USER EXPERIENCE DESIGN
CASE STUDY
Dermalogica
Artificial Intelligence Driven
Face Mapping
Mobile App
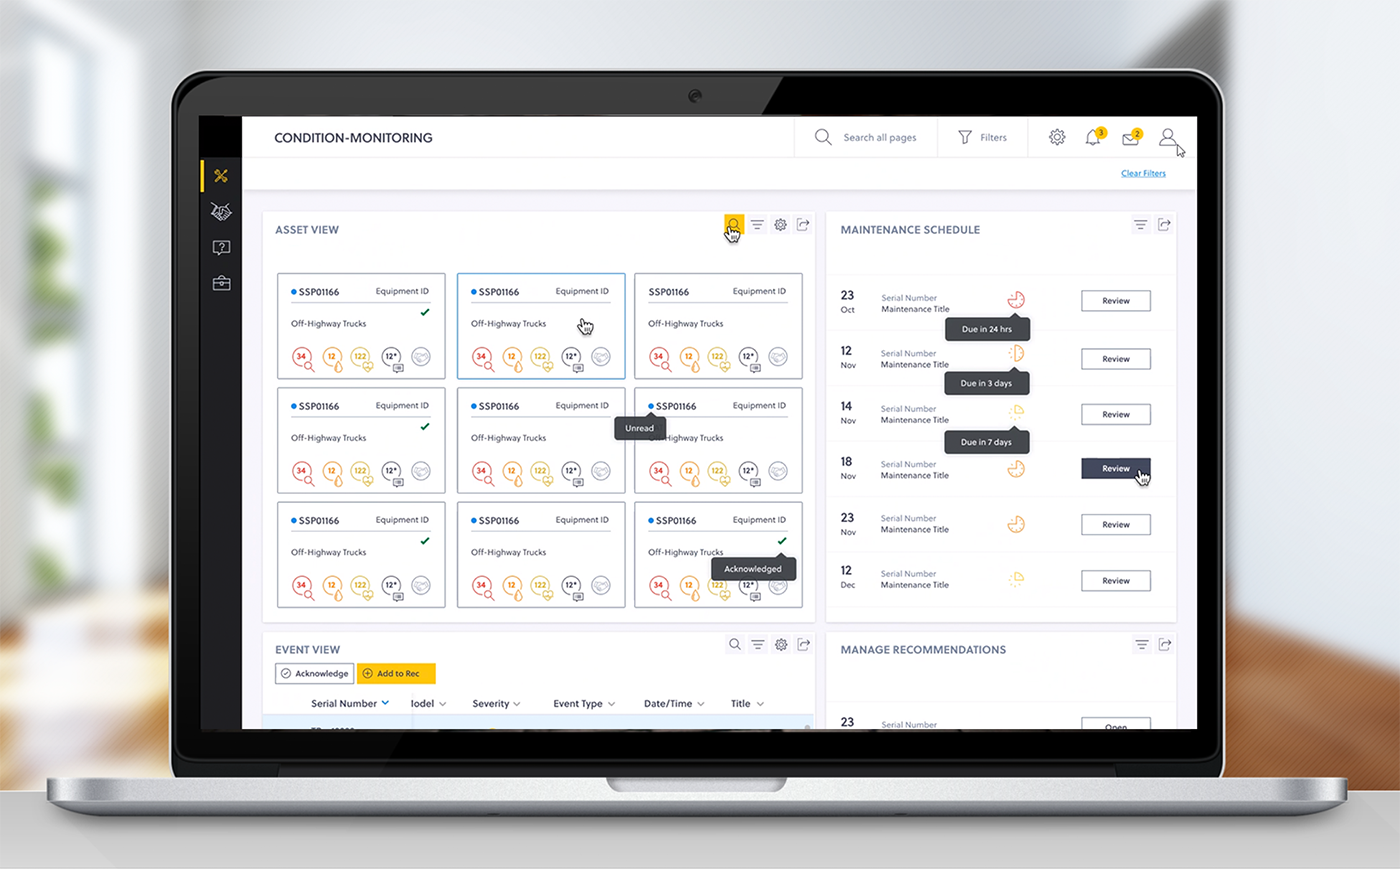
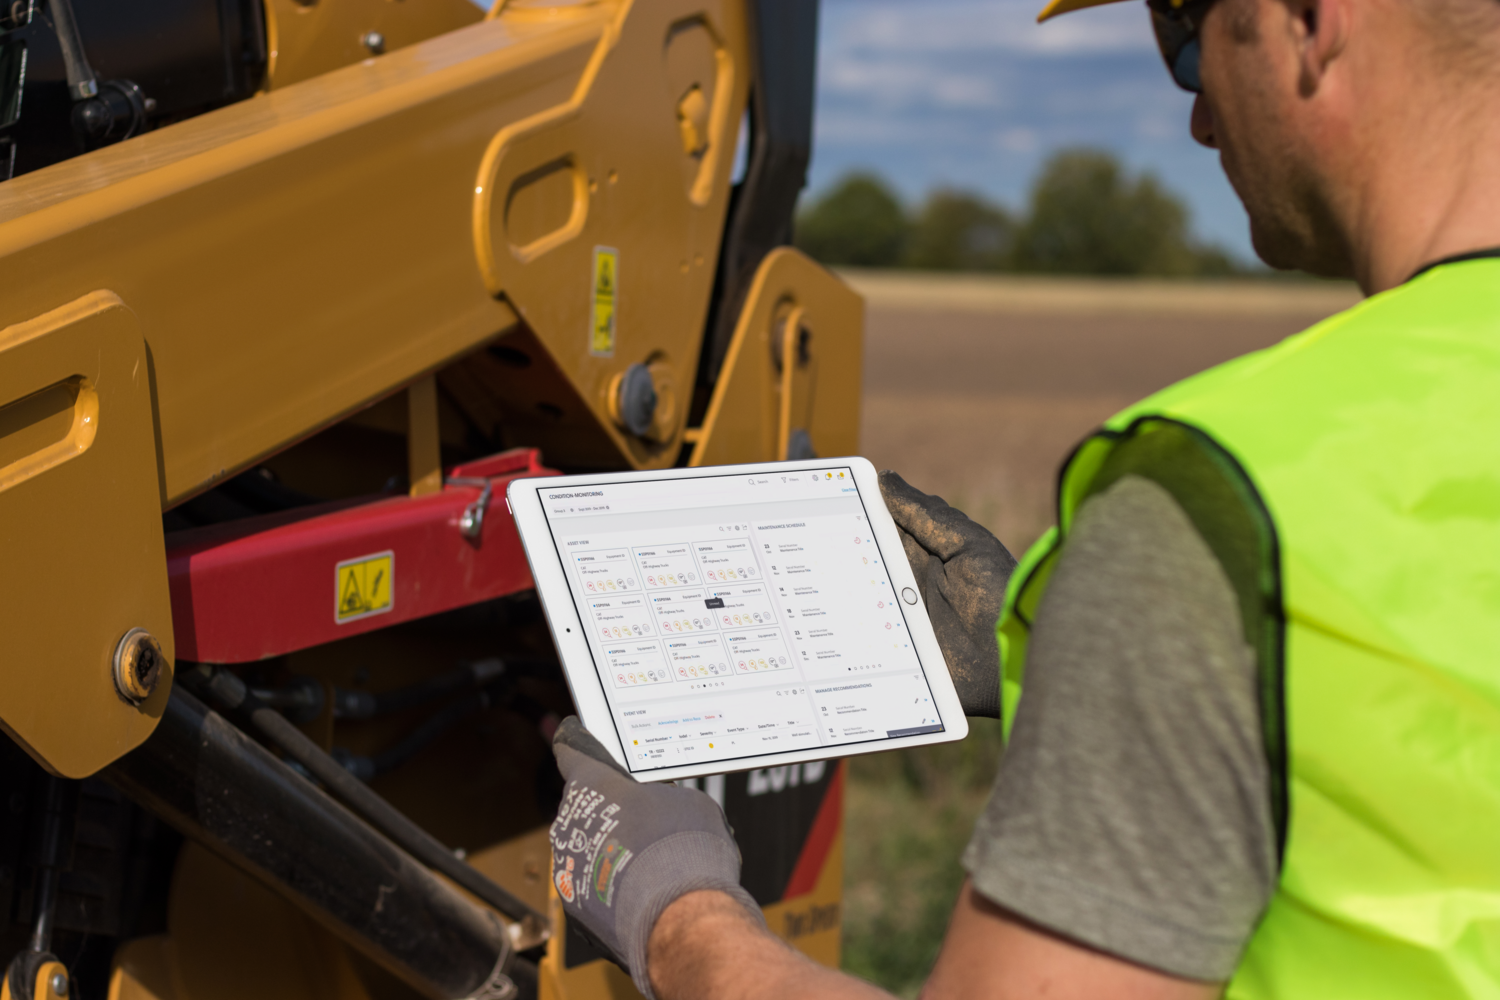
Condition Monitoring advisors receive multiple events on multiple assets many times a day every day. To provide the best coverage and value for their clients they need to be able to quickly identify existing and pending issues that need to be addressed.
THE CHALLENGE
THE SOLUTION
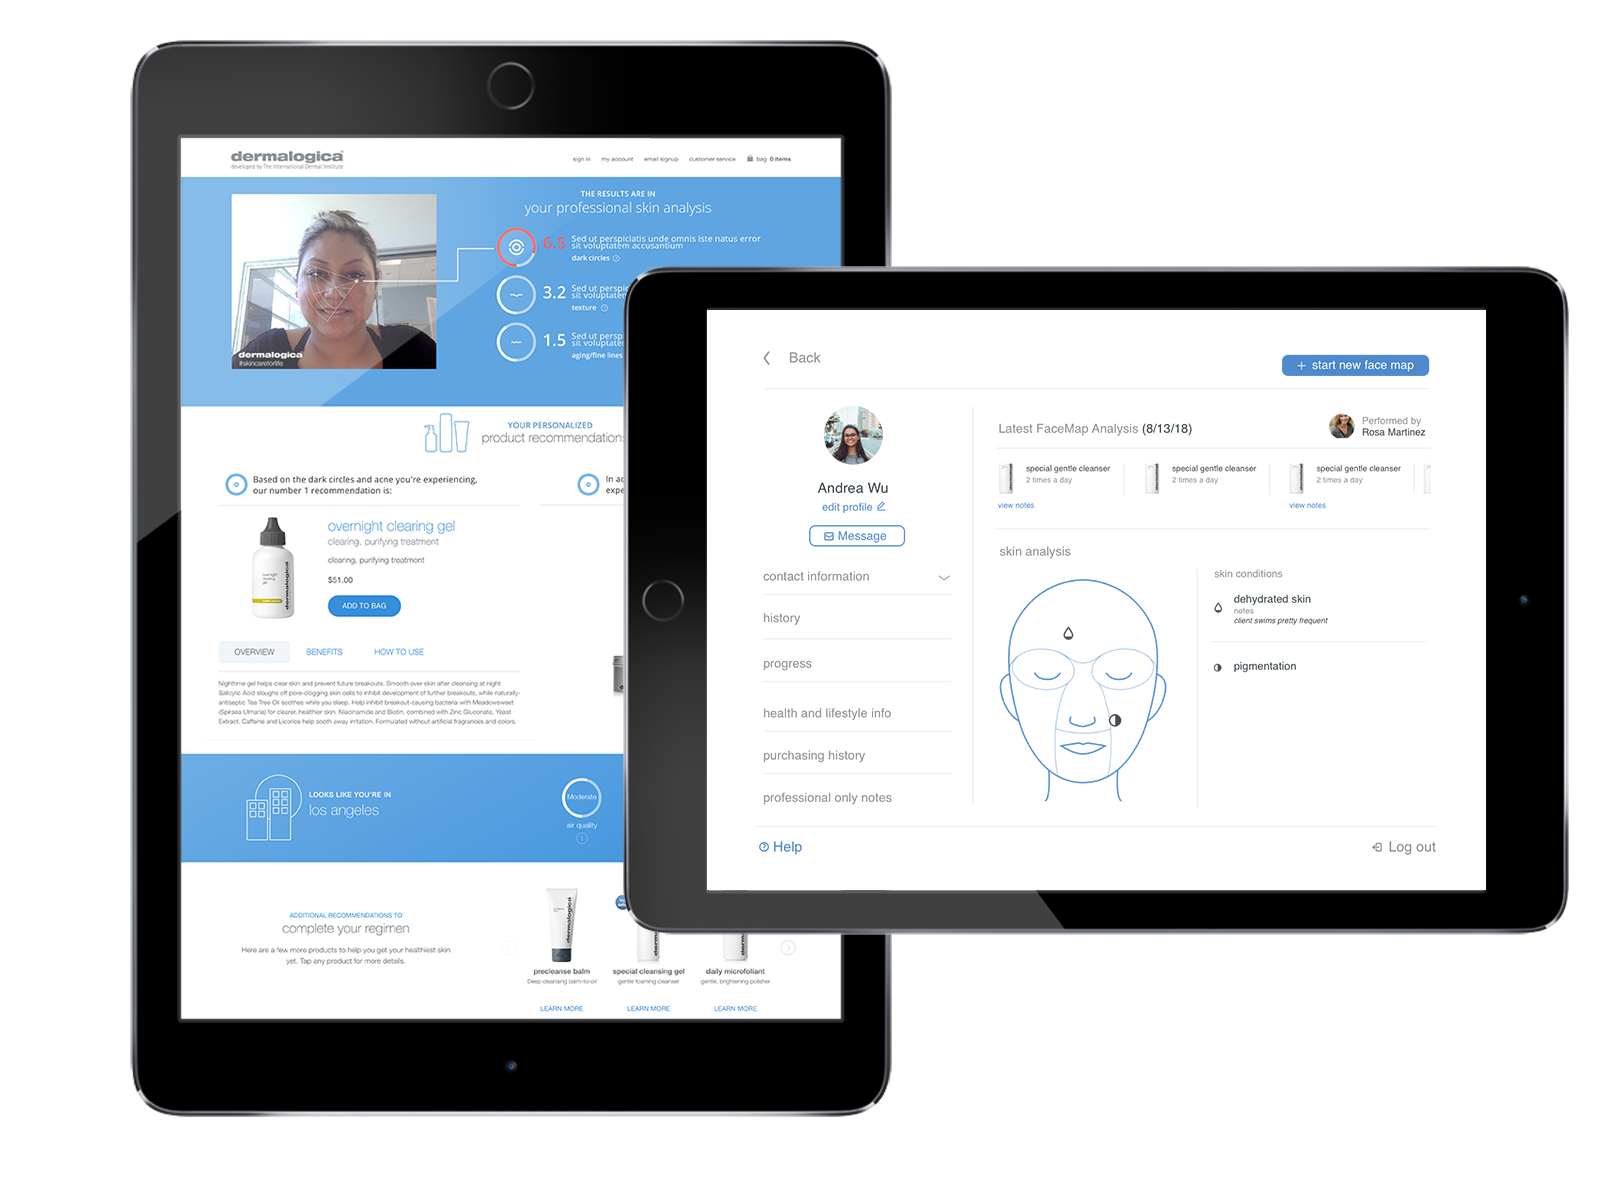
Final Mockups for the Face Mapping
iPad Application for Estheticians
My UX Process
01. UX Strategy & Design Planning
On-Site UX stRAtegy & Design Hackathon
01. UX Strategy & Design Planning
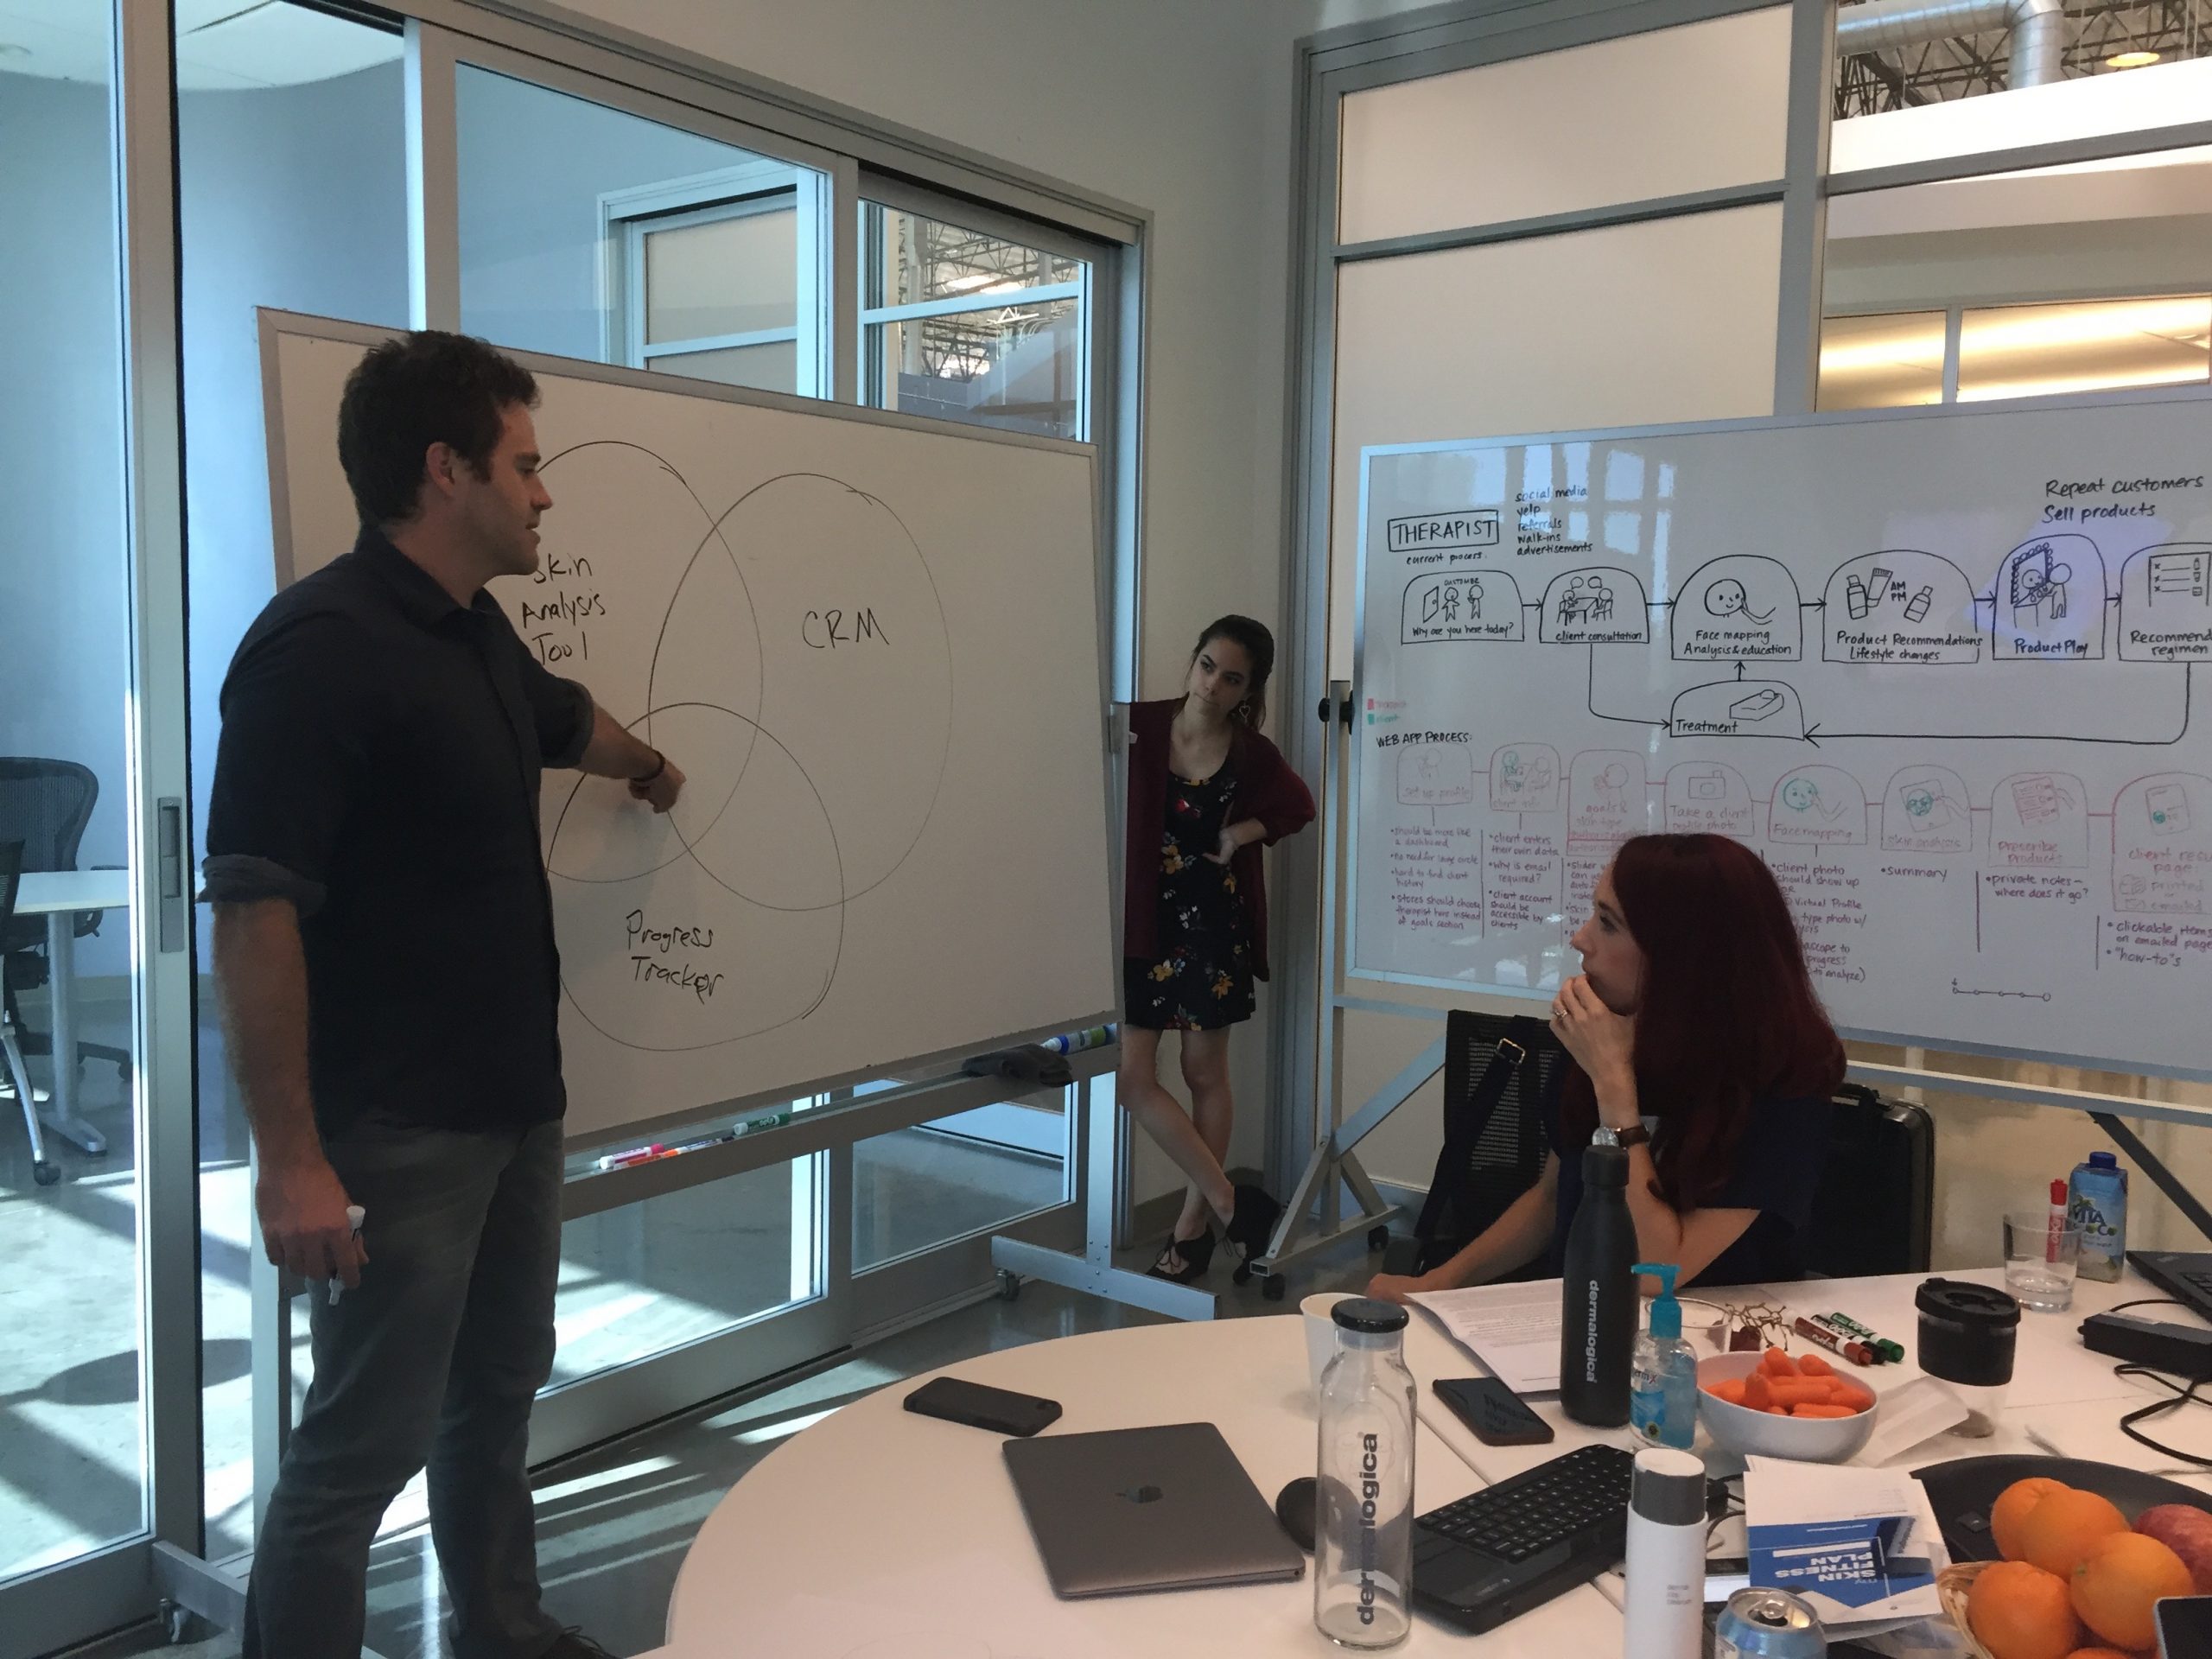
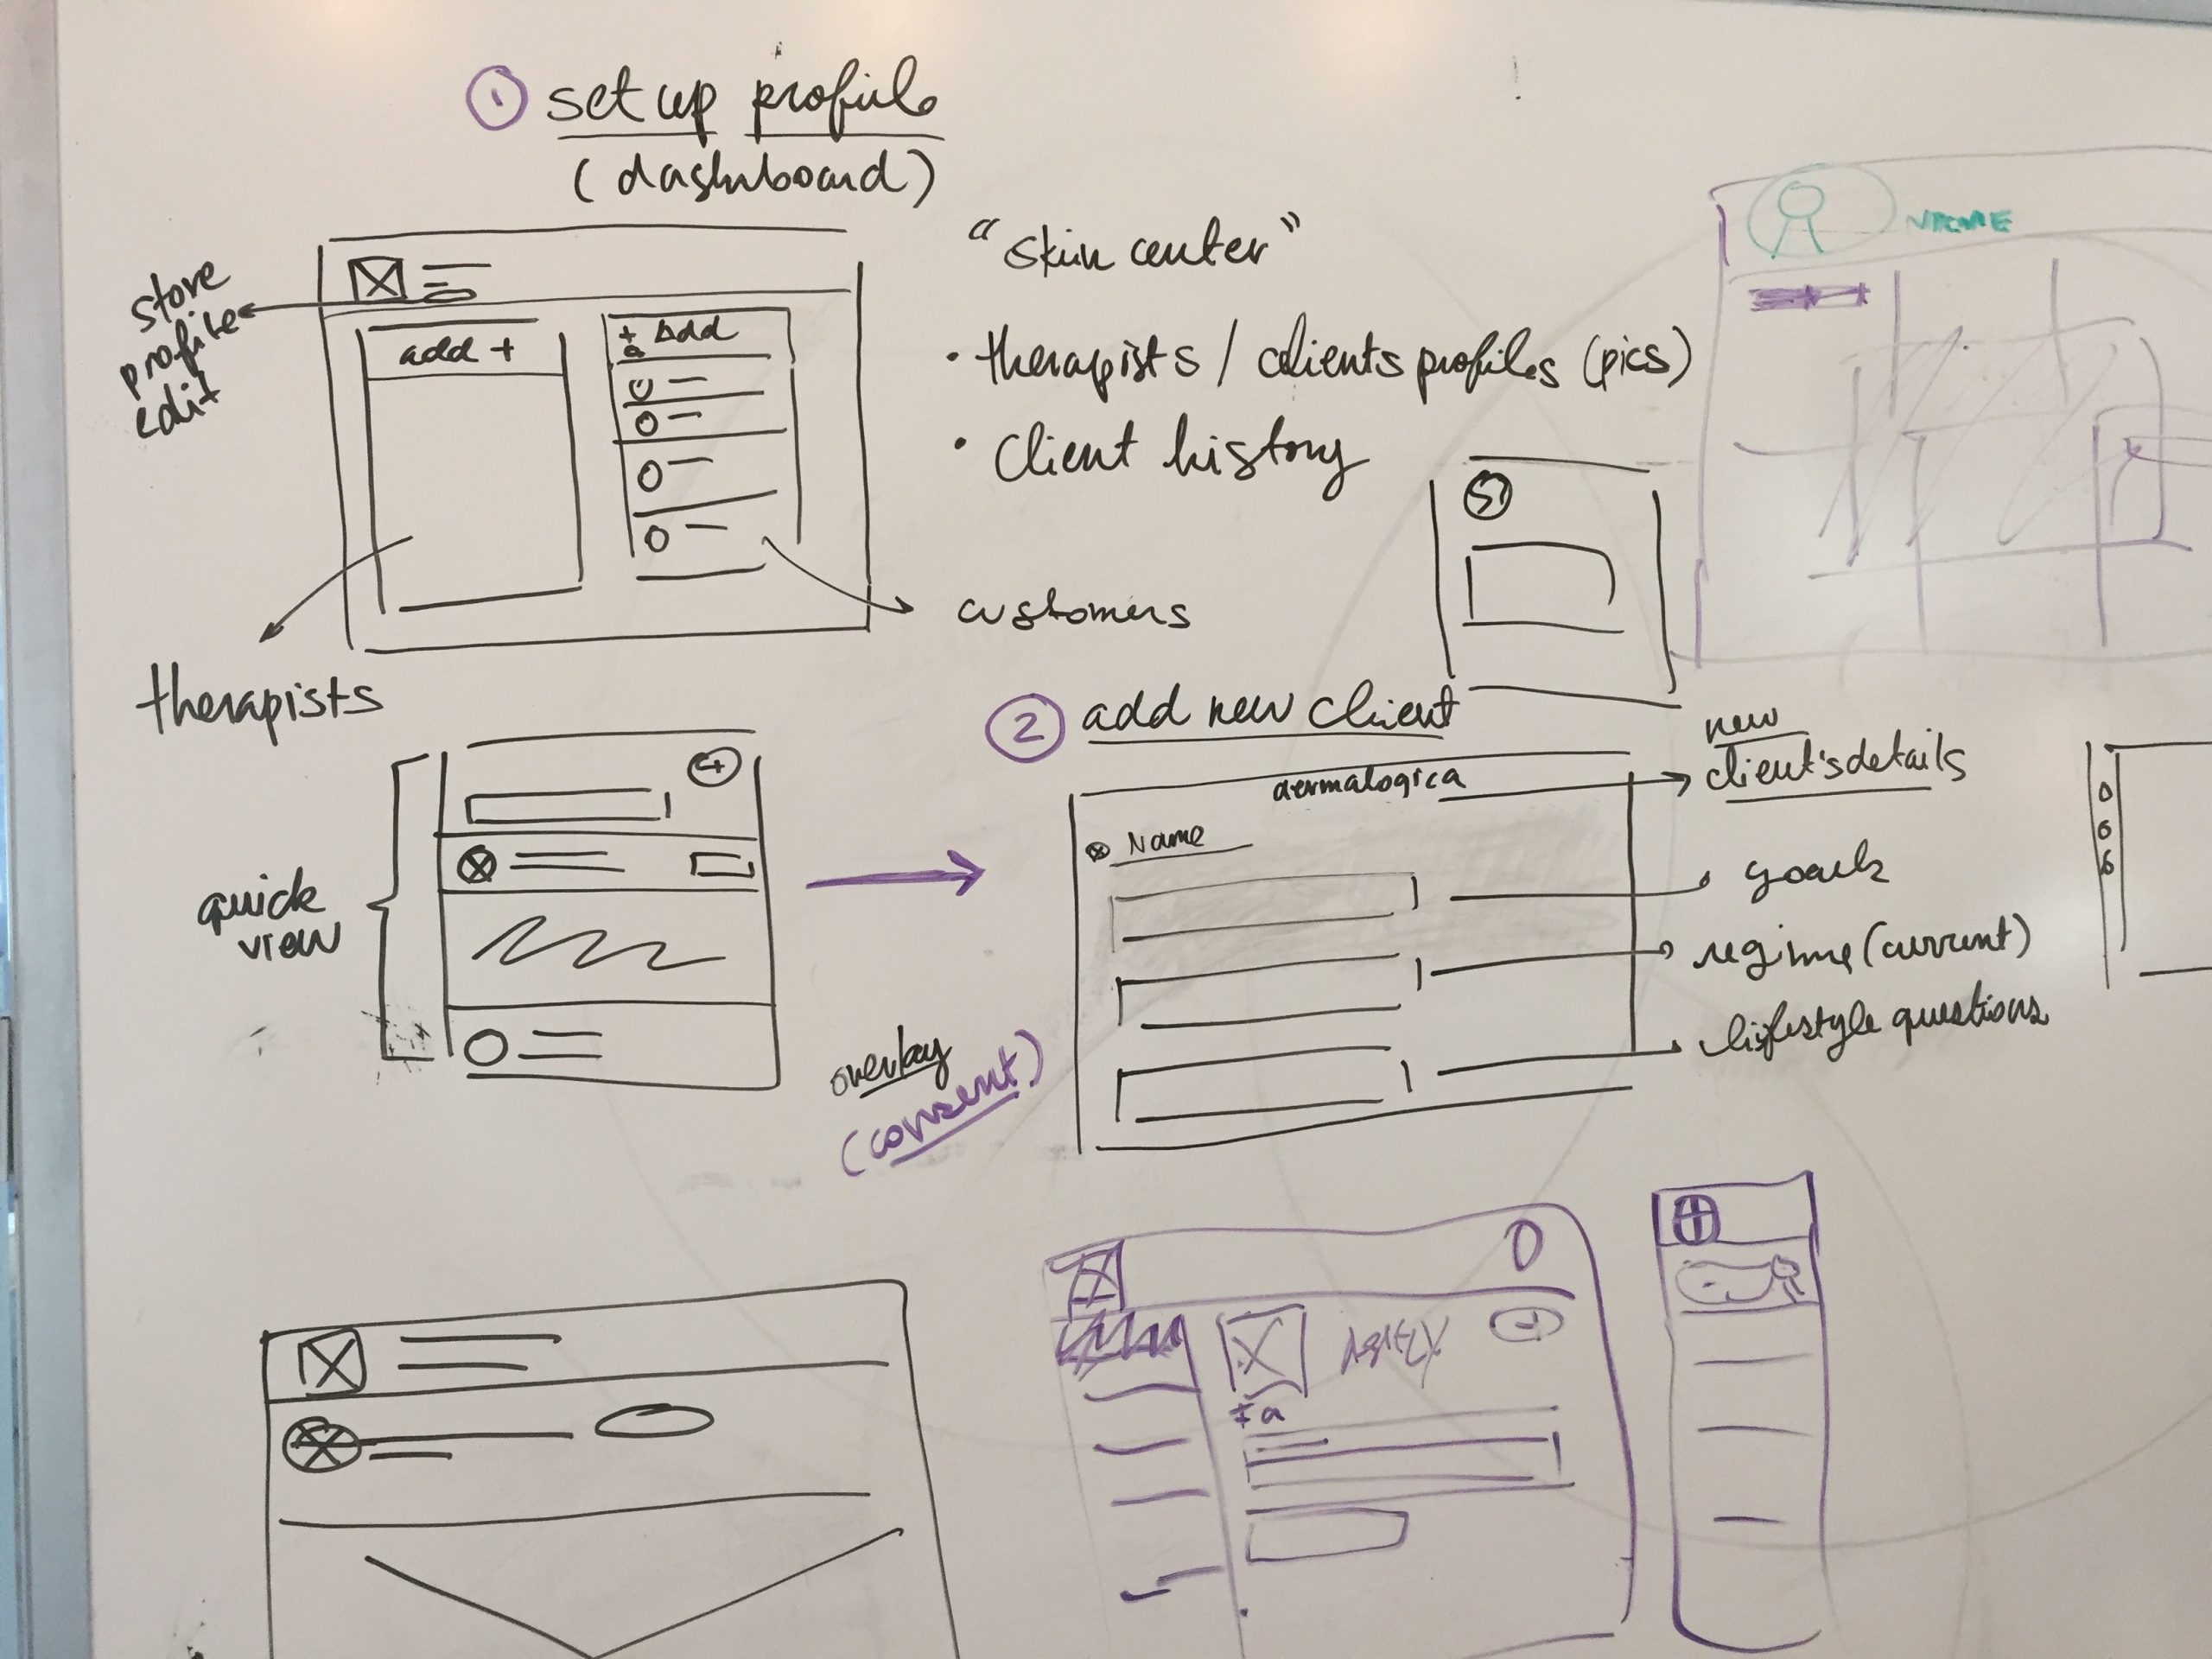
hackathon process & goalS
“Move the product forward in a Big Way.” – Dermalogic CEO
The Process
I conducted 6 user interviews with each of them performing a series of tasks through the product and recording and gauging their reactions, comments and difficulties.
The Objectives
02. Discovery & Research
BUILD A story Through User Research
Since this enterprise application is built to suit the needs of a wide variety of people across various functions, the early stage of user research was extremely crucial. This required me as the principle UX designer to spend time with many users to be able to understand the real pain points, underlying usability challenges, new opportunities while balancing the organizational goals.
In addition, part of research also included understanding the current legacy product pain points, the industry, different competitors and business stakeholders objectives.
Only after deriving the insights from all the research data, could we as a Product Team be able to move forward with our design.
Some of the goals are seeking to learn are:
VALUE PROPOSITION: What’s the Condition Monitoring Analysts END GOAL?
Why would they pay for this product?
How does the current system assist their workflow?
Do the recommendations help your in their business goals?
Does the current problem analysis tool help you attain your business goals?
The User Research & Analysis Deliverables
User Interviews
Conducted 16 User Interviews both remote and on-site.
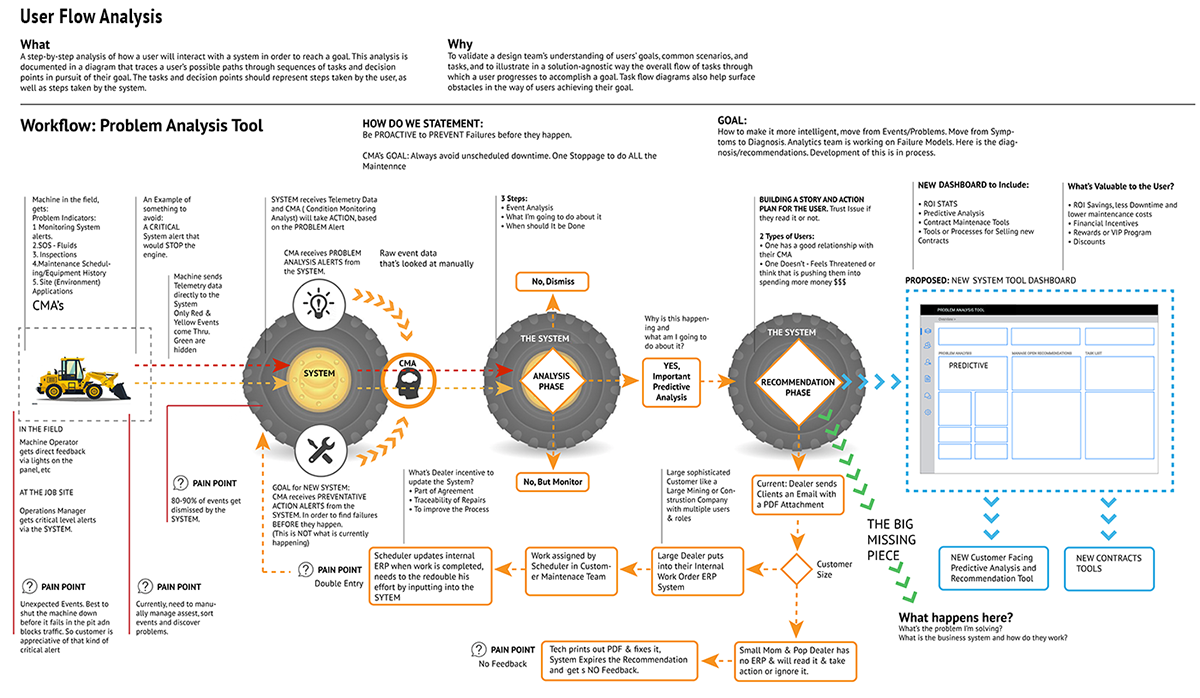
User Flow Analysis
The main path a user follows through an application.
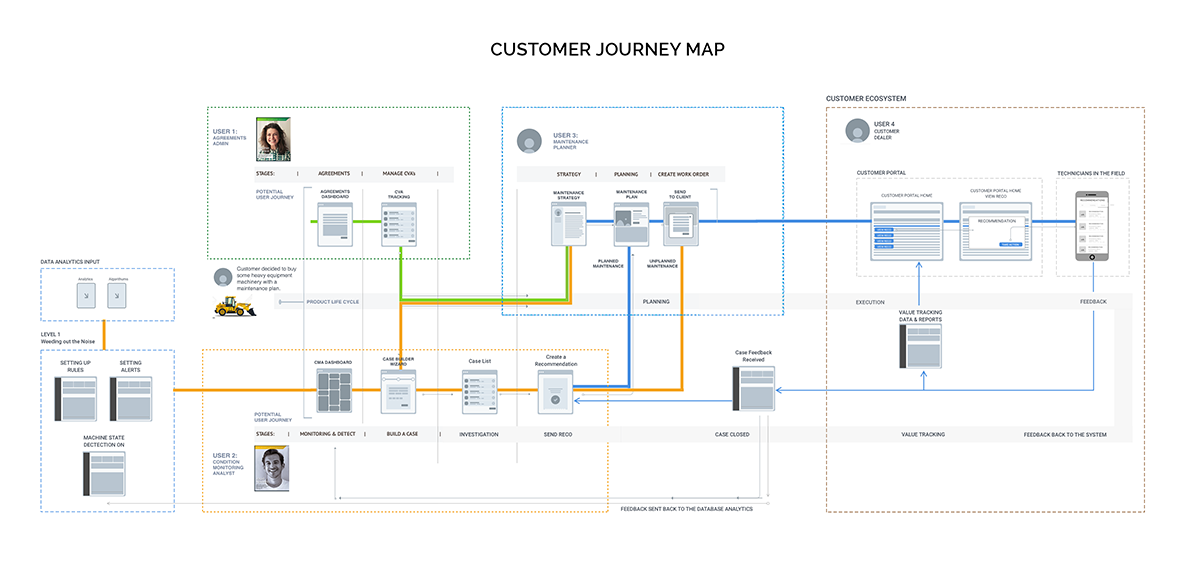
Customer Journey Map
A customer’s journey through your product.
Personas
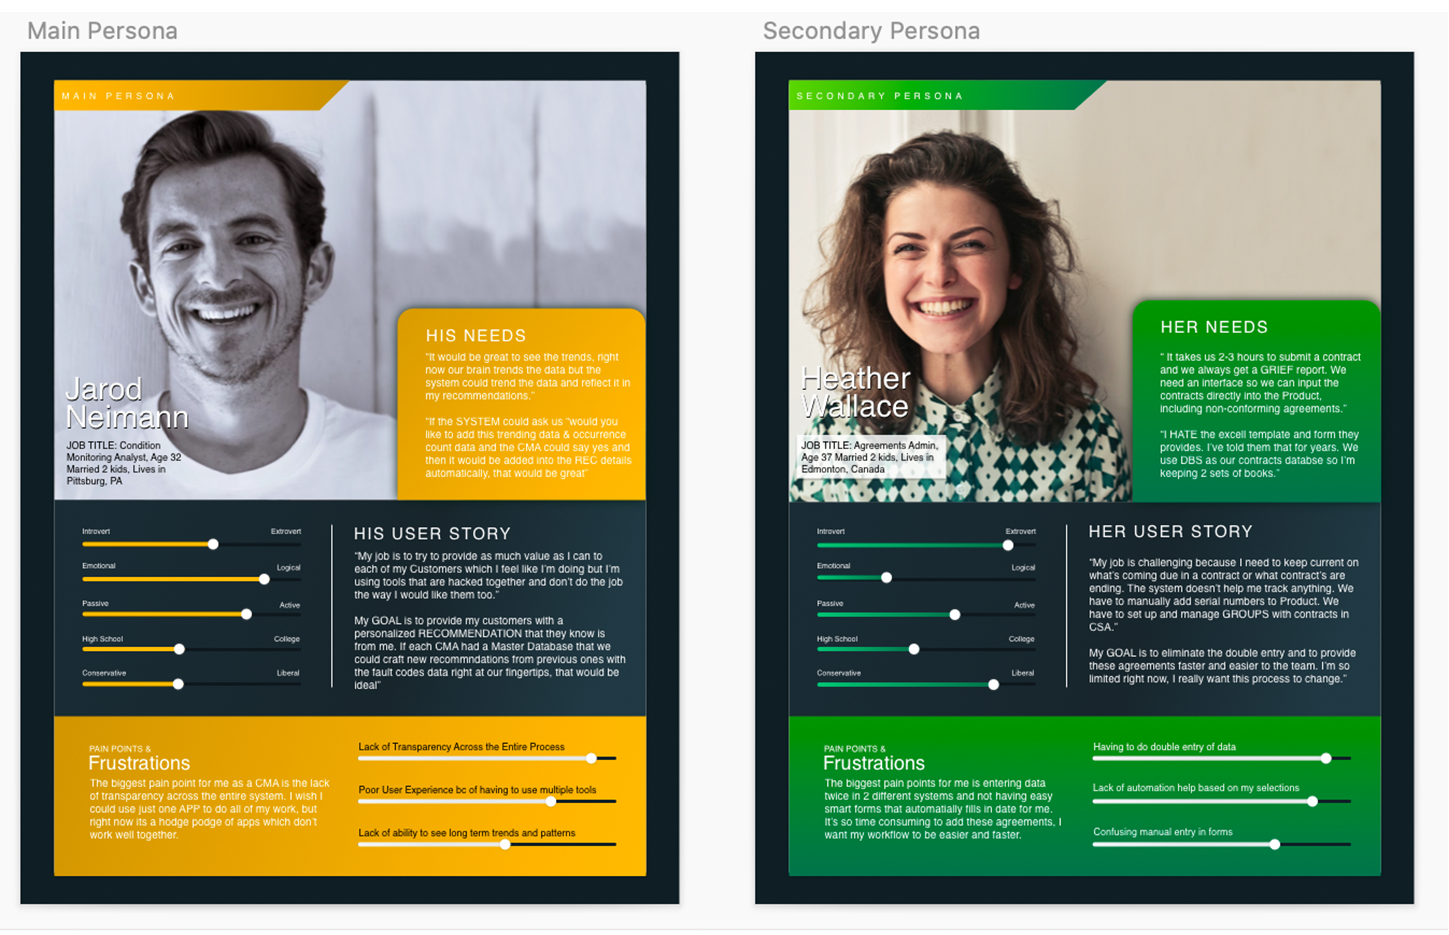
Created a Main and Secondary Persona
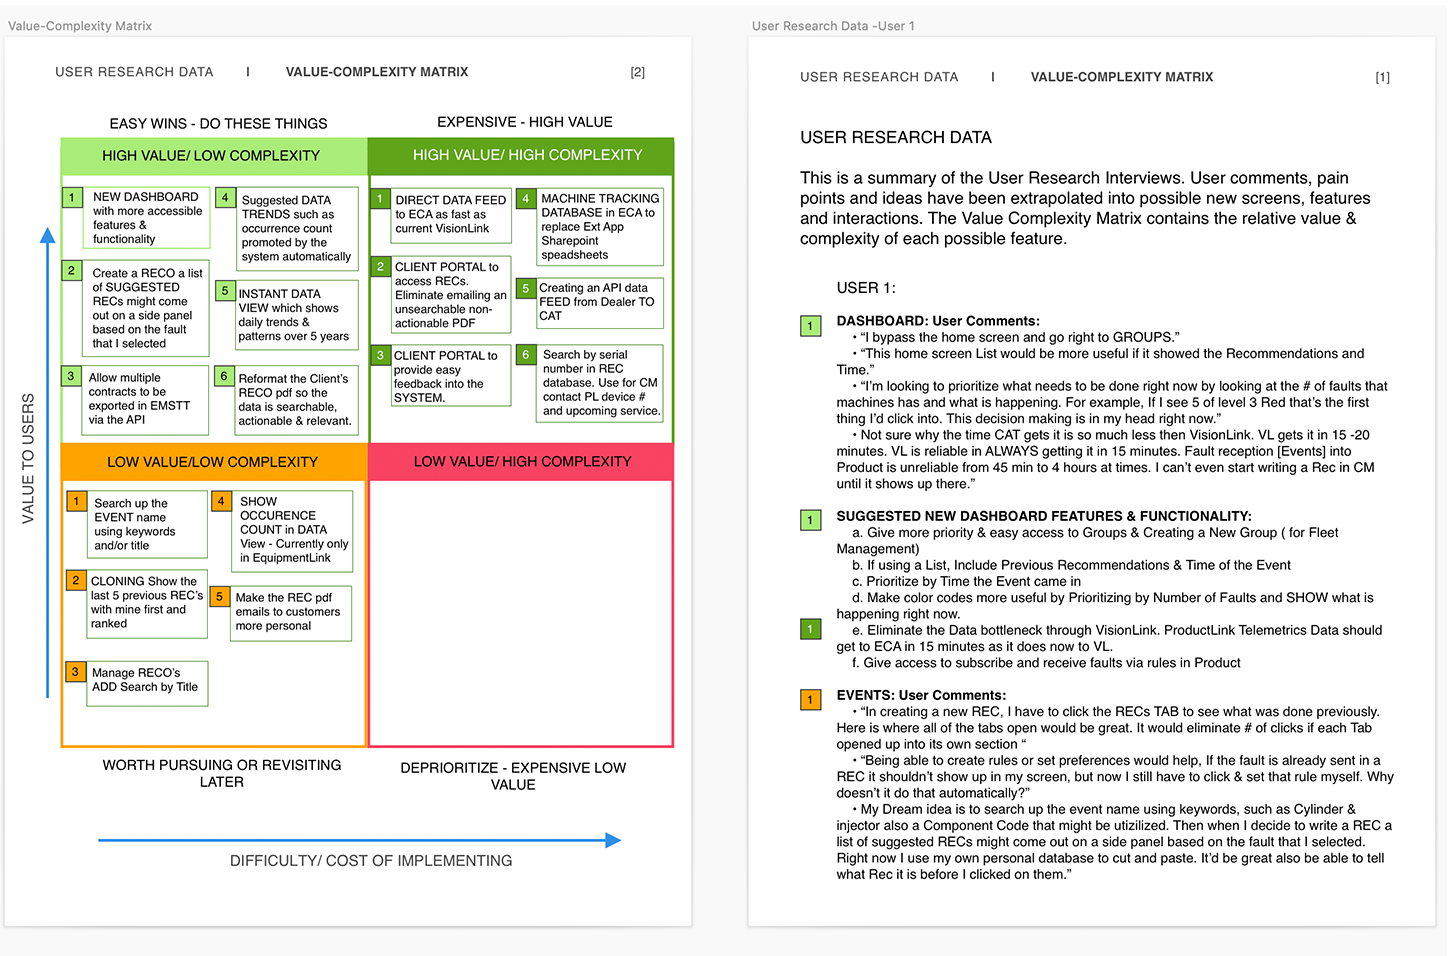
Value Complexity Matrix
A value matrix based on our user interview data.
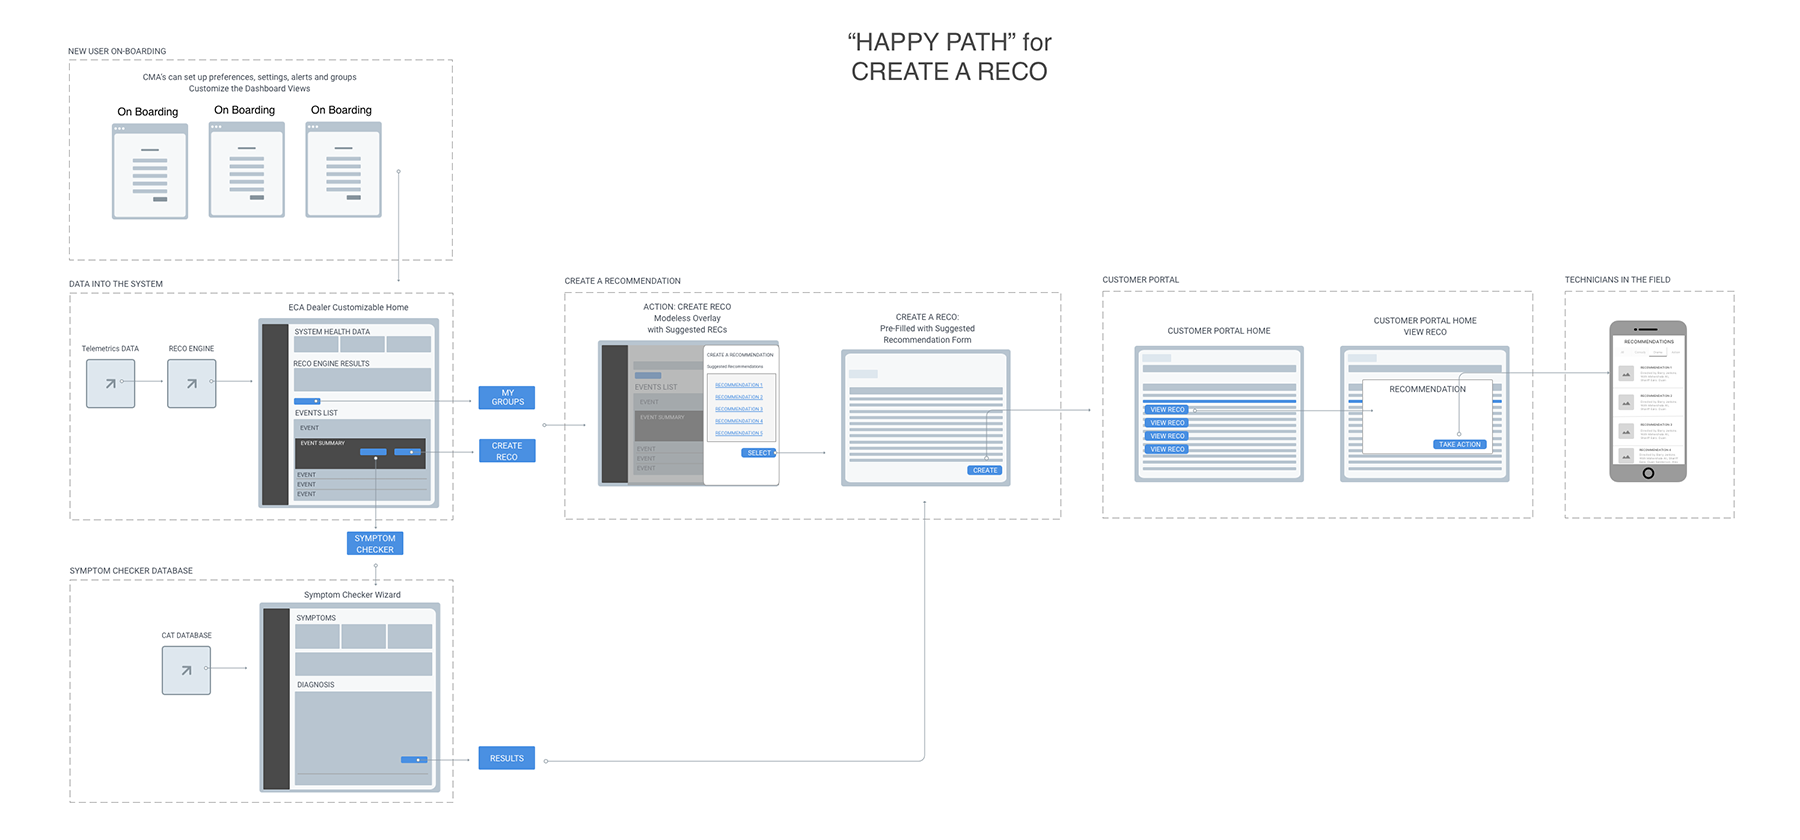
Wire Flow Map
A map of the site flows and external interactions.
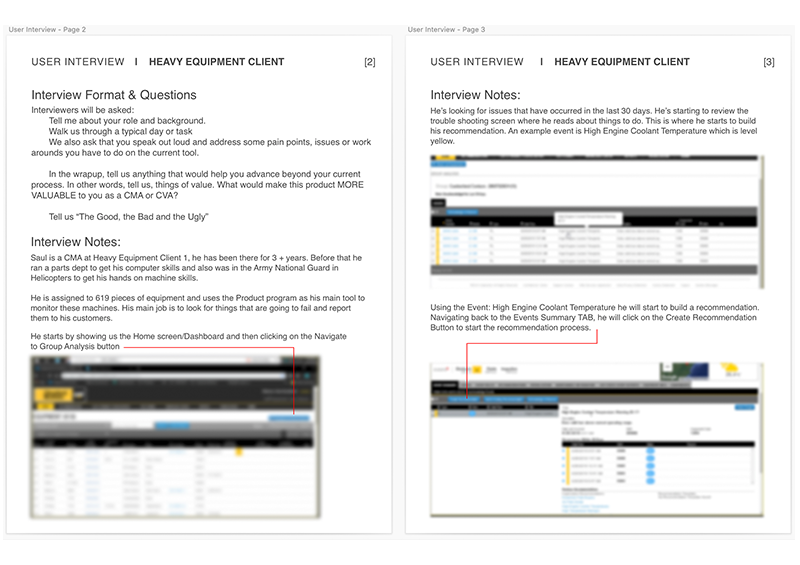
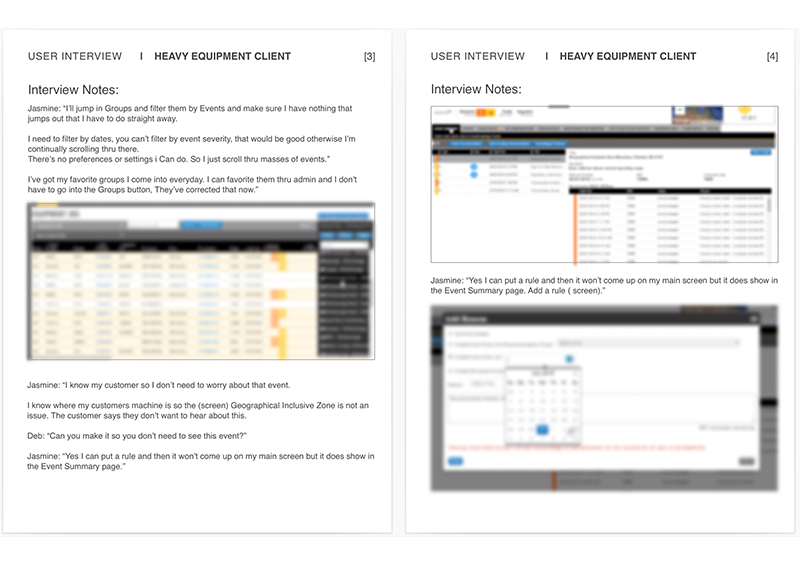
User Research Interviews
I conducted 16 user interviews both on-site and on Zoom video calls. Each participant had various client demographics in terms of heavy construction machinery, mining equipment and fossil fuel industry equipment.
Research Questions
We are seeking to learn:
VALUE PROPOSITION: What’s the CMA’s END GOAL?
Why would they pay for this product?
How does the current system help your workflow?
Do the recommendations help you in your business goals?
Does the current problem tool help you attain your business goals?
How does this tool help you attain your business goals?
Methodologies
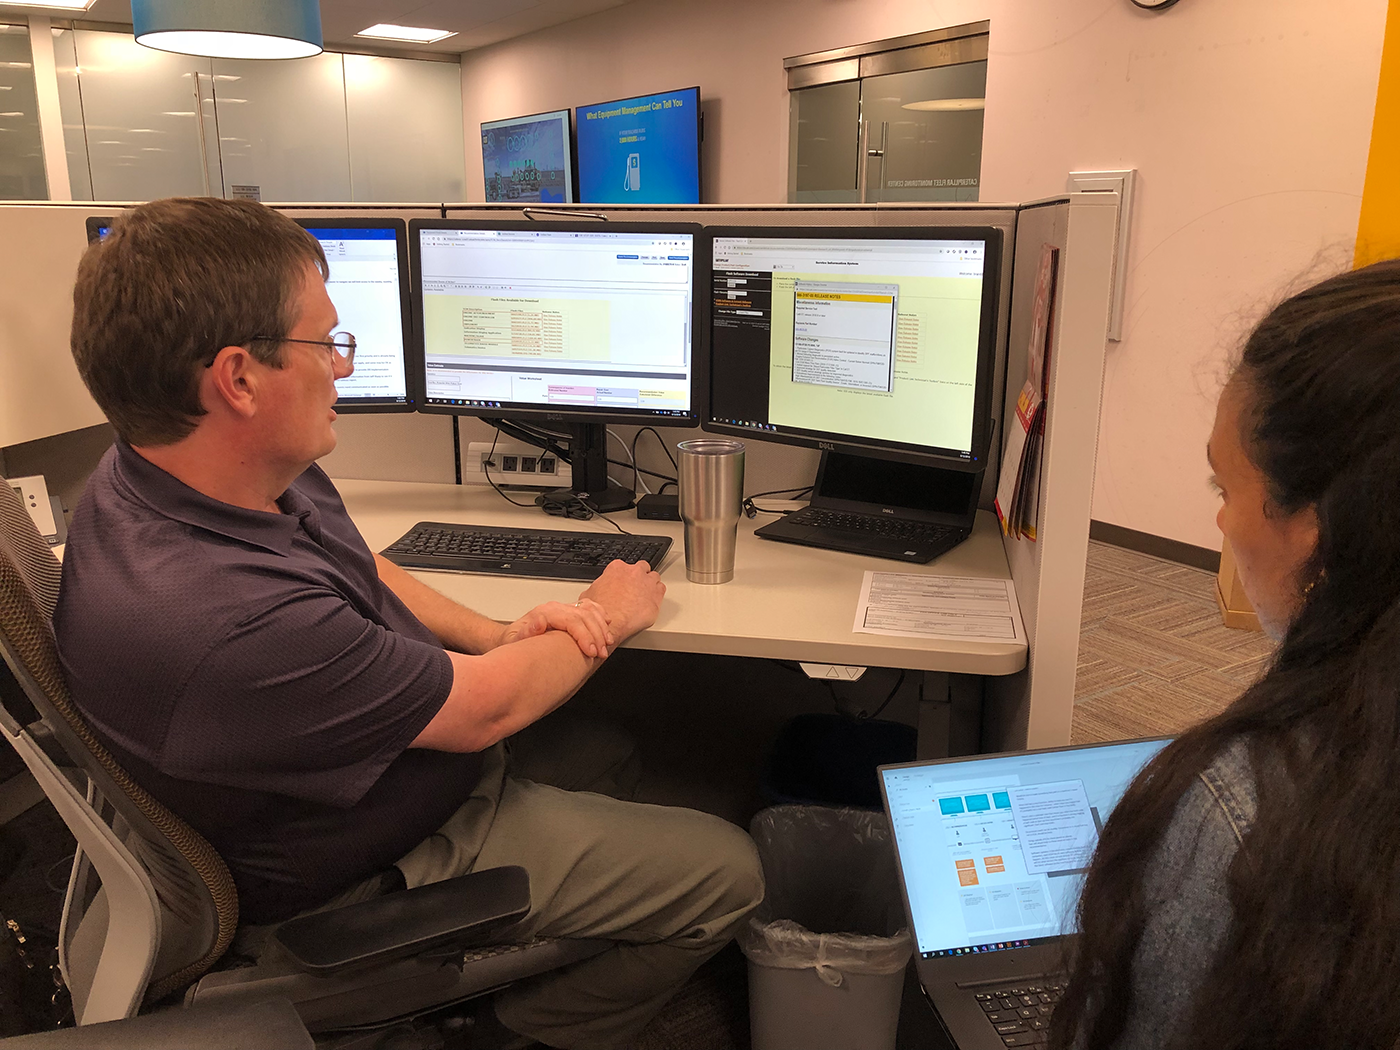
Observe – Contextual Enquiries
Observe – Task Analysis
Contextual Inquiry, also known as ethnographic study, is at its heart a research technique which takes place in the environment where the user is engaged in the problem space.
We observe users performing tasks within the problem space, and probe them about their behaviors, to understand their mindset, problems, and opportunities better.
Engage, Customer interviews are 1:1 interviews conducted with the people that operate within the problem space we wish to explore.

User Flow Analysis
User Flows
A User Flow is the main path a user follows through an application. They are like mini user journeys. The flow can branch out into many a non-linear paths. By visualizing this path we saw problems, pain points and possible solutions for optimizing the user experience.
The complexity of the Client’s current CM ( Condition Monitoring) product was such that I suggested we create a baseline Task Flow Analysis. The goal was to understand the current situation user’s had to work in and then to optimize users ability to accomplish the main task with the least amount of friction. This helped a great deal in our Design meetings to think through the design before building out the product.
Customer Journey Map
This Journey Map shows both of our Personas going through their task to achieve their optimal goals. It also shows the Product LifeCycle and the final Customer EcoSystem.
03. User Research Analysis
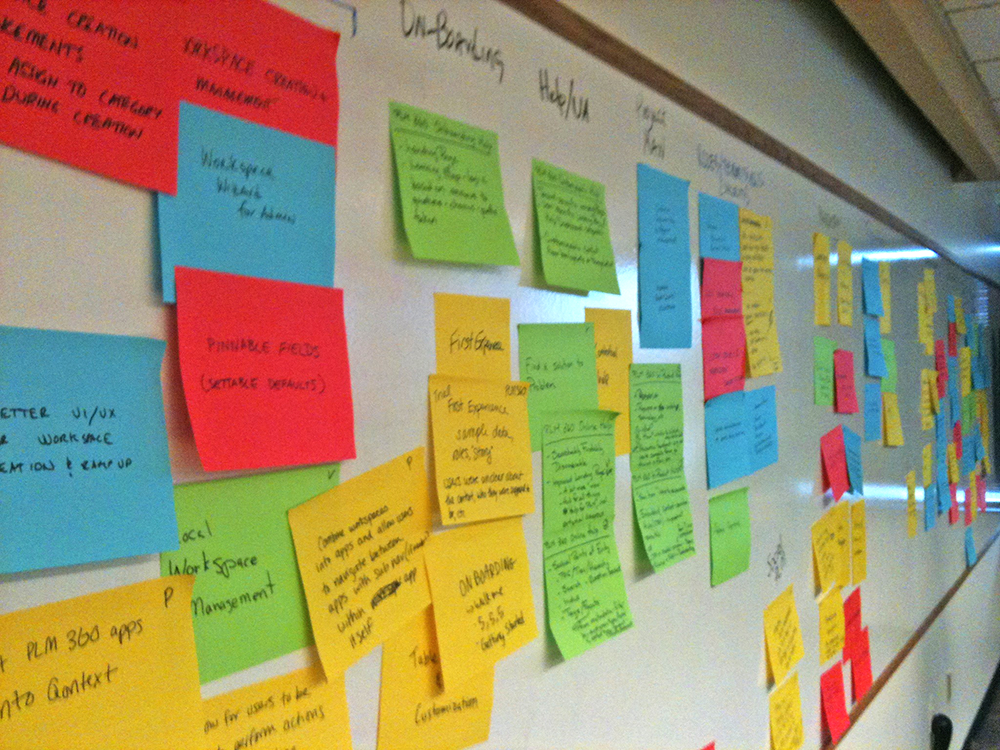
Synthesize our Data
The aim of the Analysis phase is to draw insights from data collected during the Research phase.
Capturing, organizing and making inferences from the “what” can help UX Designers begin to understand the “why”. Communicating the designer’s understanding back to end-users helps to confirm that any assumptions being made are valid.
At this point, we now have identified a clear list of patterns based on our user research. We did this by classifying our user research findings in 3 categories:
• User goals (things they’d like to obtain)
• User pains (things they have trouble with)
• User tasks (things they have to do)
Then we defined and clarified actionable point of view (POV) or problem statements.
A POV statement can be defined as [User/Persona] + [Need] + [Insight]
Personas
Value Complexity Matrix
As its name implies, value–complexity matrices plot the potential value of a product feature alongside the complexity of implementing such features. The business value of a project can be categorized as either high or low, whereas the implementation complexity of a project can be represented as low or high.
Wire Flow Map
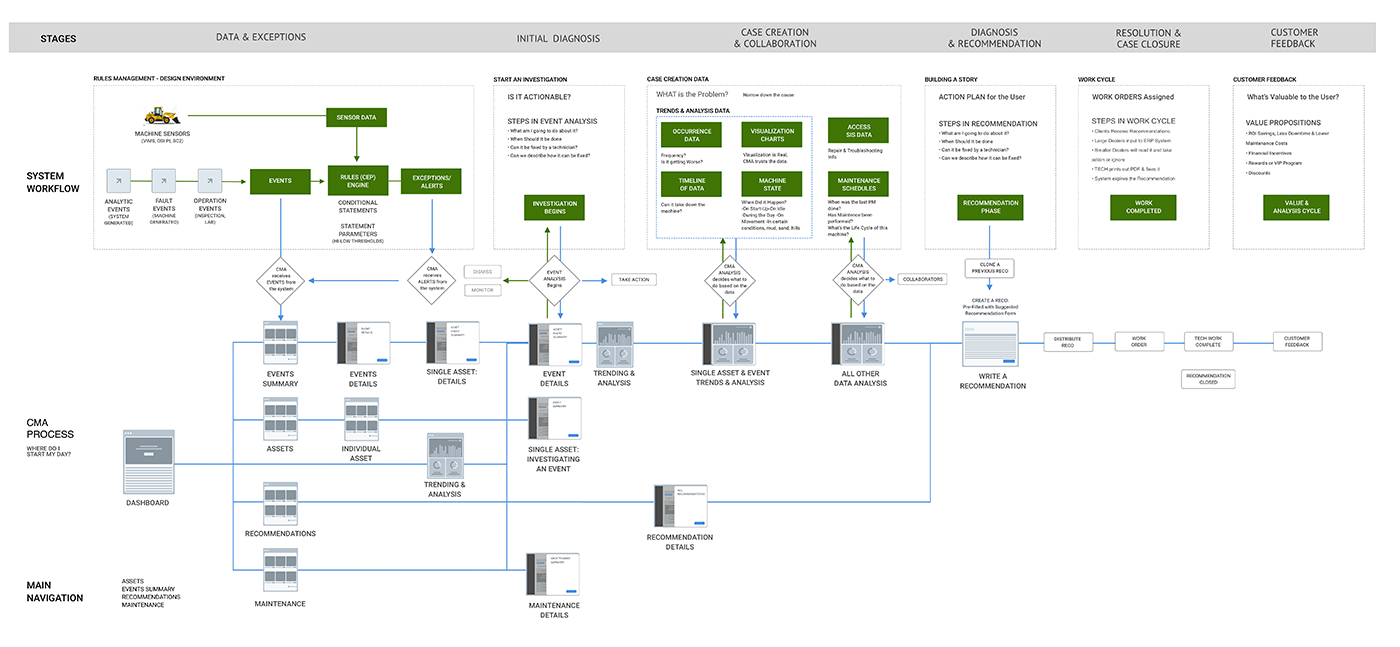
Again because of the complexity of the systems we were trying to link together, I created a Wire Flow Map. This particular one combines a wireframe-style of page layout designs with a simplified flowchart way of representing phases of the product journey and the interactions at each of those areas.
04. Design
The DESIGN PHASE
The Design phase of a UX project is collaborative (involving input and ideas from different people) and iterative (meaning that it cycles back upon itself to validate ideas and assumptions).
Building on the user feedback loop established in previous phases, the premise of the Design phase is to put ideas in front of users, get their feedback, refine them, and repeat. These ideas may be represented by paper prototypes, interactive wireframes, or semi-functioning prototypes, all deliberately created in low-fidelity to delay any conversation relating to graphic identity, branding or visual details.
A Wire Flow “Happy Path”
Create a Recommendation Flow
Dashboard Wire Frames
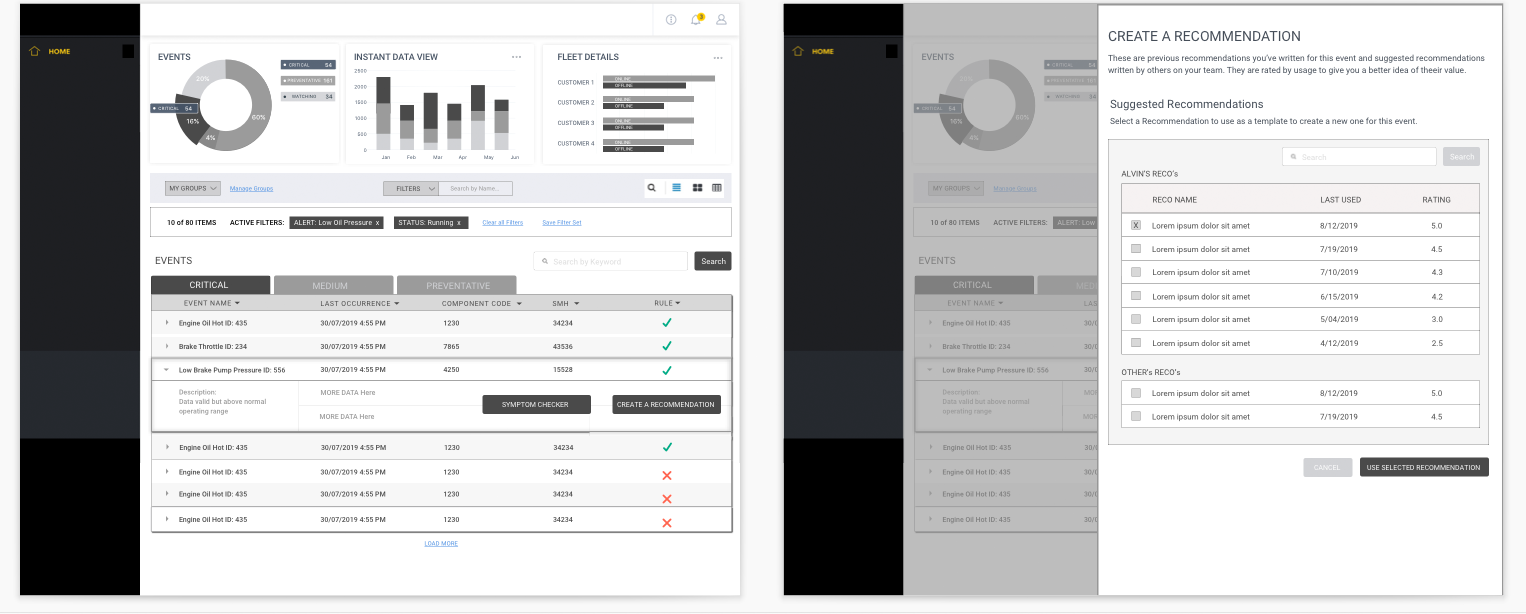
High Fidelity Mockups
Dashboard Design
