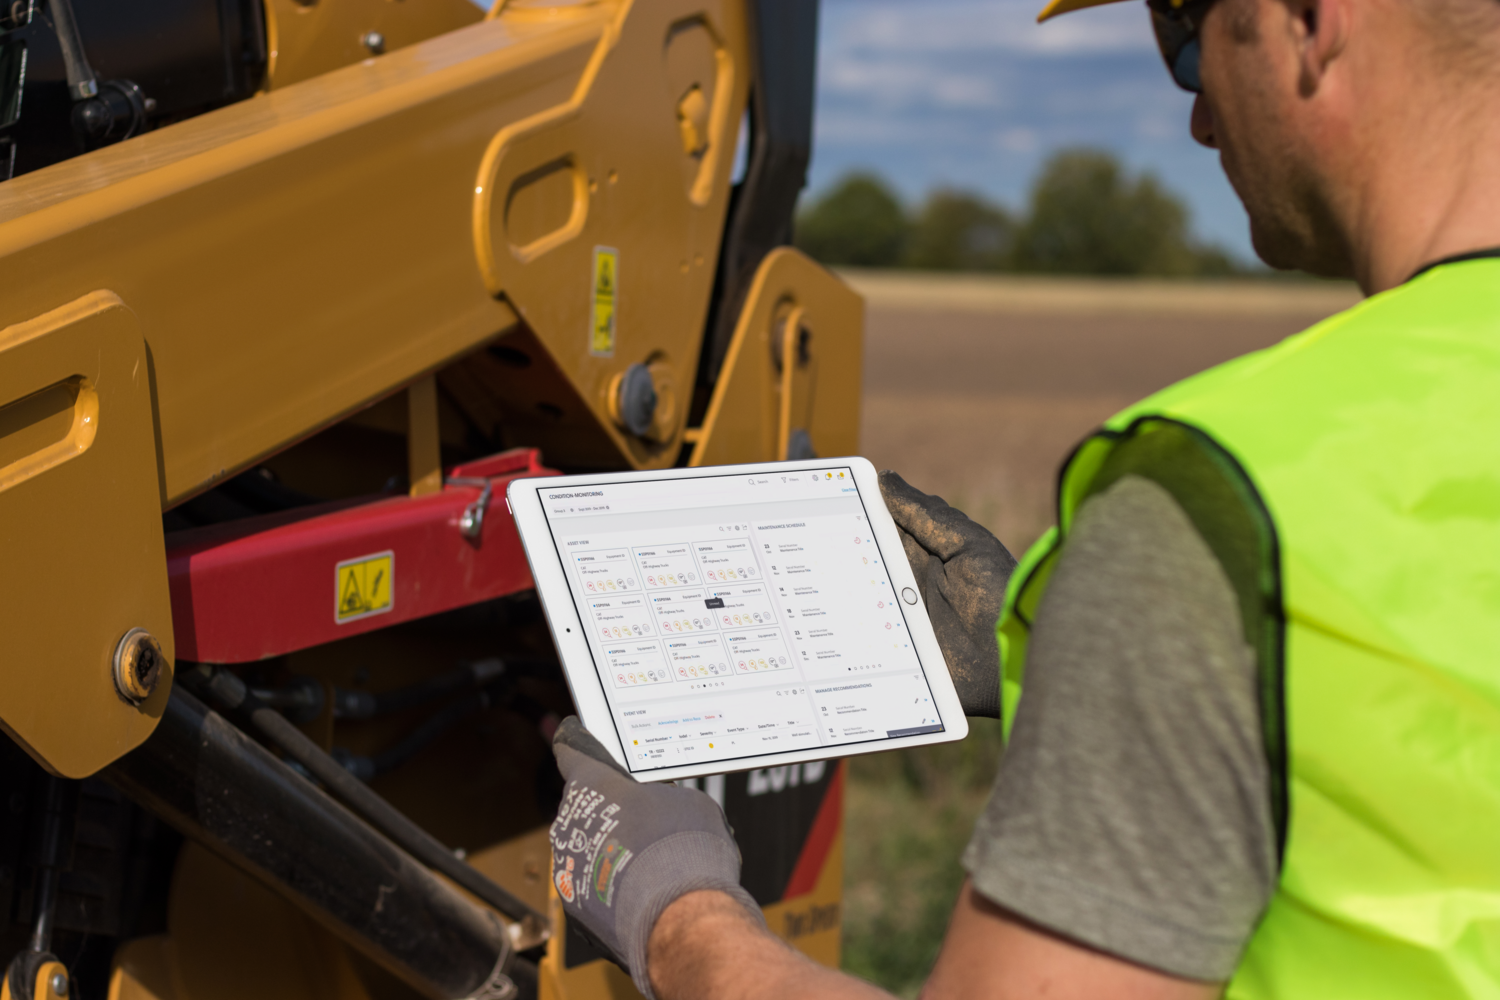
USER EXPERIENCE DESIGN
CASE STUDY
Enterprise
SaaS Web Application –
Condition Monitoring
THE OBJECTIVE
THE CHALLENGE
BUSINESS GOAL
“Providing the right info at the right time to the right people”
– Bill H. , Product Manager
THE SOLUTION
Our Main Problems to Solve
- How do we manage all of this NOISE?
- How do we take that data and create a CASE that is meaningful and actionable?
- How do we complete the FEEDBACK loop to get data back to the System?
MY UX ROLE & RESPONSIBILITES
UNDERSTANDING COMPLEX BUSINESS SYSTEM LOGIC
As the lead UX Designer for Caterpillar’s Condition Monitoring System, I delved deep into the complex decision-making processes used by Condition Monitoring Analysts (CMAs). The challenge went far beyond interface design – it required understanding intricate relationships between equipment sensor data, maintenance patterns, and predictive analytics.
I mapped out detailed decision matrices that incorporated over 15 different sensor input types, 200+ error codes, and specifications for more than 50 equipment models, all while ensuring real-time data processing capabilities.
Working closely with CMAs, I documented their mental models and decision frameworks, translating complex troubleshooting processes into systematic workflows. This involved creating sophisticated event correlation rules, defining equipment-specific thresholds, and developing time-based alert patterns. The resulting system could process multiple data streams simultaneously, identifying potential issues before they became critical failures.
STAKEHOLDER COLLABORATION & PROJECT LEADERSHIP
My role required extensive collaboration across multiple organizational levels. I led bi-weekly cross-functional meetings with engineering SMEs, product managers, developers, security specialists, and end-user representatives. These sessions were crucial for aligning technical capabilities with user needs and business objectives. Monthly executive presentations kept leadership informed of project milestones, KPI tracking, and ROI analysis, ensuring continued support and resource allocation.
The stakeholder management process was particularly complex due to the global nature of the project. I coordinated with teams across different time zones, managing expectations and ensuring clear communication channels. Regular technical reviews with engineering SMEs helped validate our approach, while feedback sessions with end users kept the development focused on practical applications.
01. UX Strategy Plan
BUILD A UX STRATEGY
The first phase of my Design Process was to create a User Experience Strategy RoadMap. My USER Experience Strategy is a shared holistic vision for what a product or service will be from the end user’s perspective. Before our design team started creating any of the product’s features or interface, I lead our team in evaluating ideas to determine what met both user and business goals most effectively. I believe that defining a user experience strategy up front is critical to making sure that all design decisions map back to a vision that is supported by research and that has defined success criteria.
My UX Strategy for this project included:
- Evaluating the current user experience for the existing legacy application.
- Analyzing features & attributes from competing products and services.
- Identifying opportunities that exist to improve this experience.
- Analyzing characteristics of my target audiences.
- Determining what is the Definition of success for this project.
- Determining what from the business’ perspective will make this product or service successful.
- Deciding how will we measure success and What would be the big win.
02. Discovery & Research
BUILD A story Through User Research
Since this enterprise application is built to suit the needs of a wide variety of people across various functions, the early stage of user research was extremely crucial. This required me as the principle UX designer to spend time with many users to be able to understand the real pain points, underlying usability challenges, new opportunities while balancing the organizational goals.
In addition, part of research also included understanding the current legacy product pain points, the industry, different competitors and business stakeholders objectives.
Only after deriving the insights from all the research data, could we as a Product Team be able to move forward with our design.
The User Research & Analysis Deliverables
User Interviews
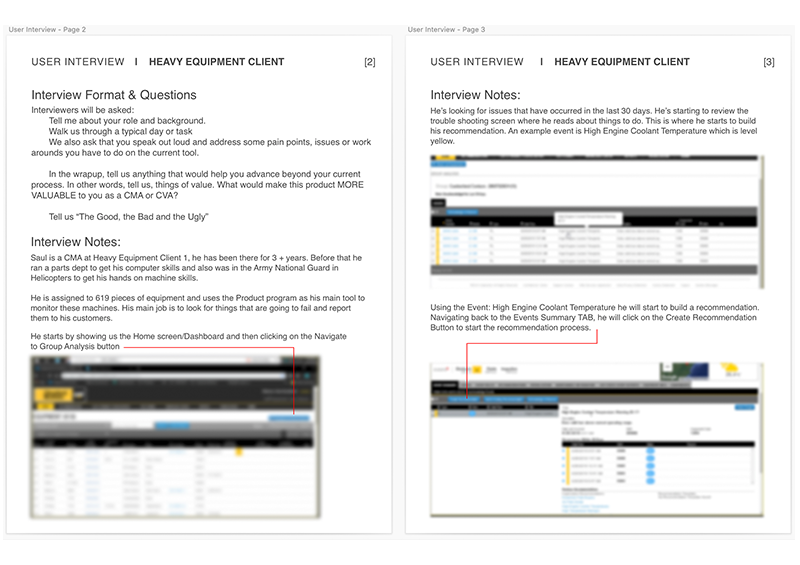
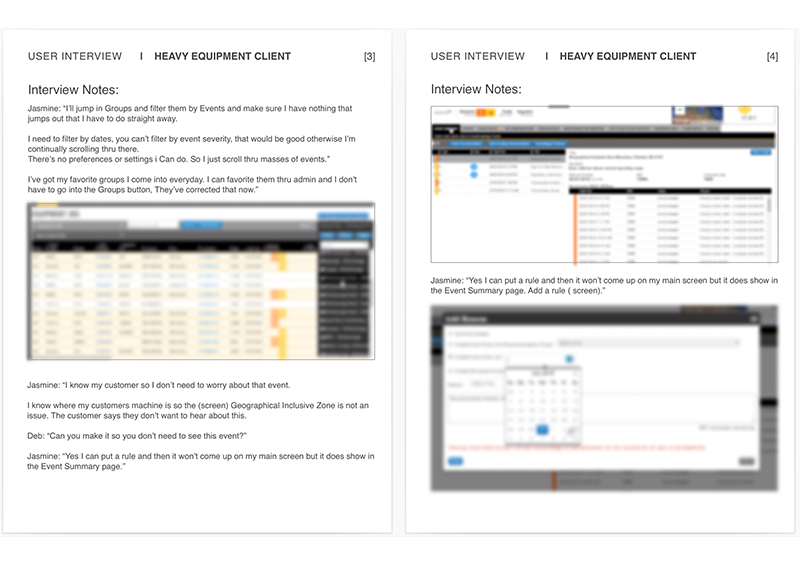
Conducted 16 User Interviews both remote and on-site.
User Flow Analysis
The main path a user follows through an application.
Customer Journey Map
A customer’s journey through your product.
Personas
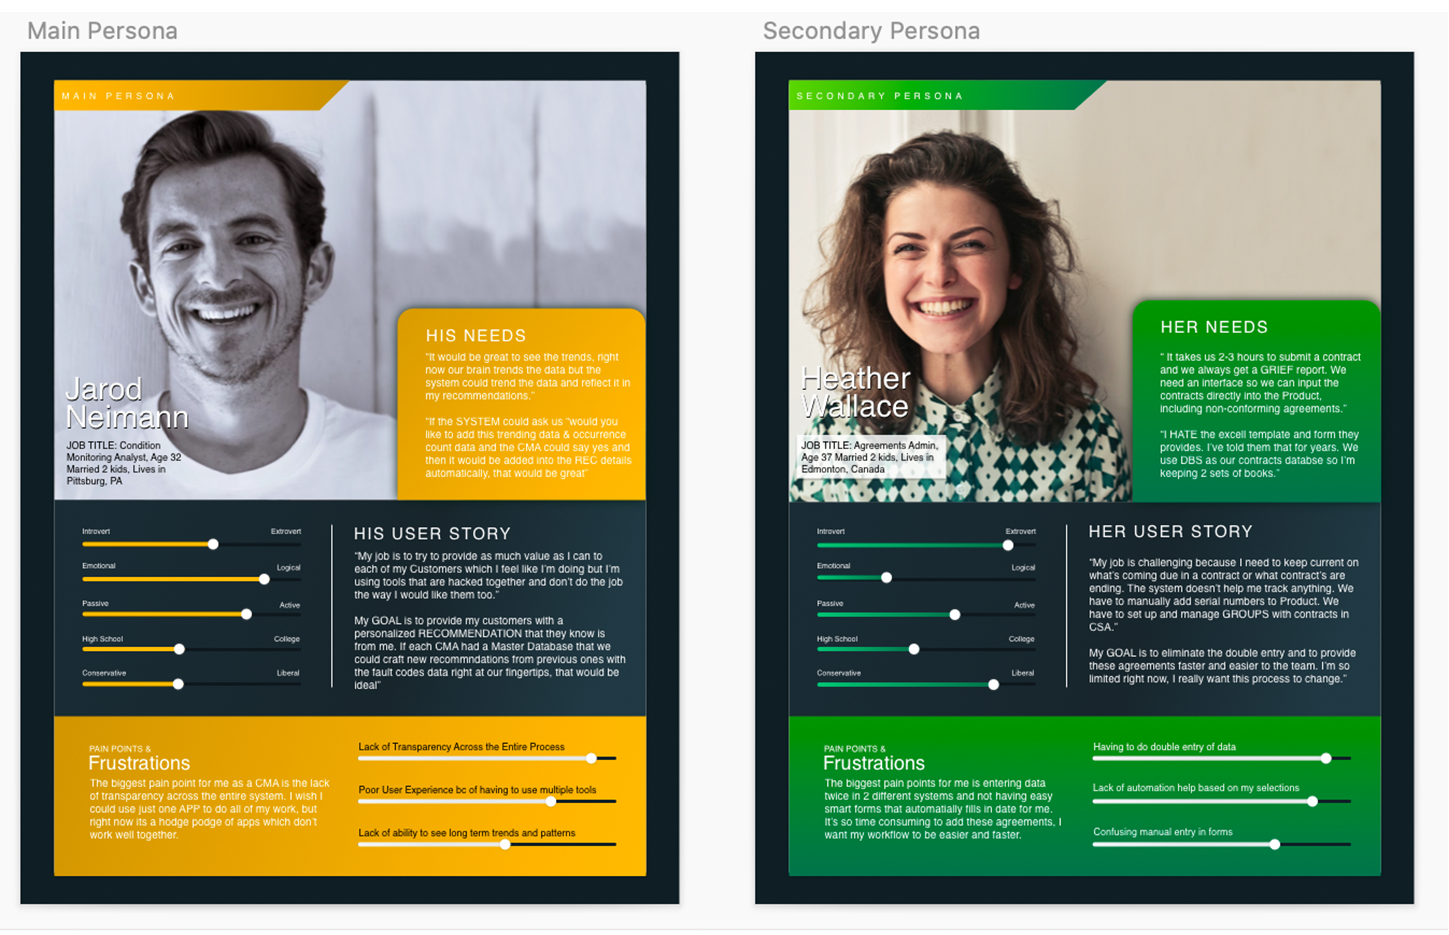
Created a Main and Secondary Persona
Value Complexity Matrix
A value matrix based on our user interview data.
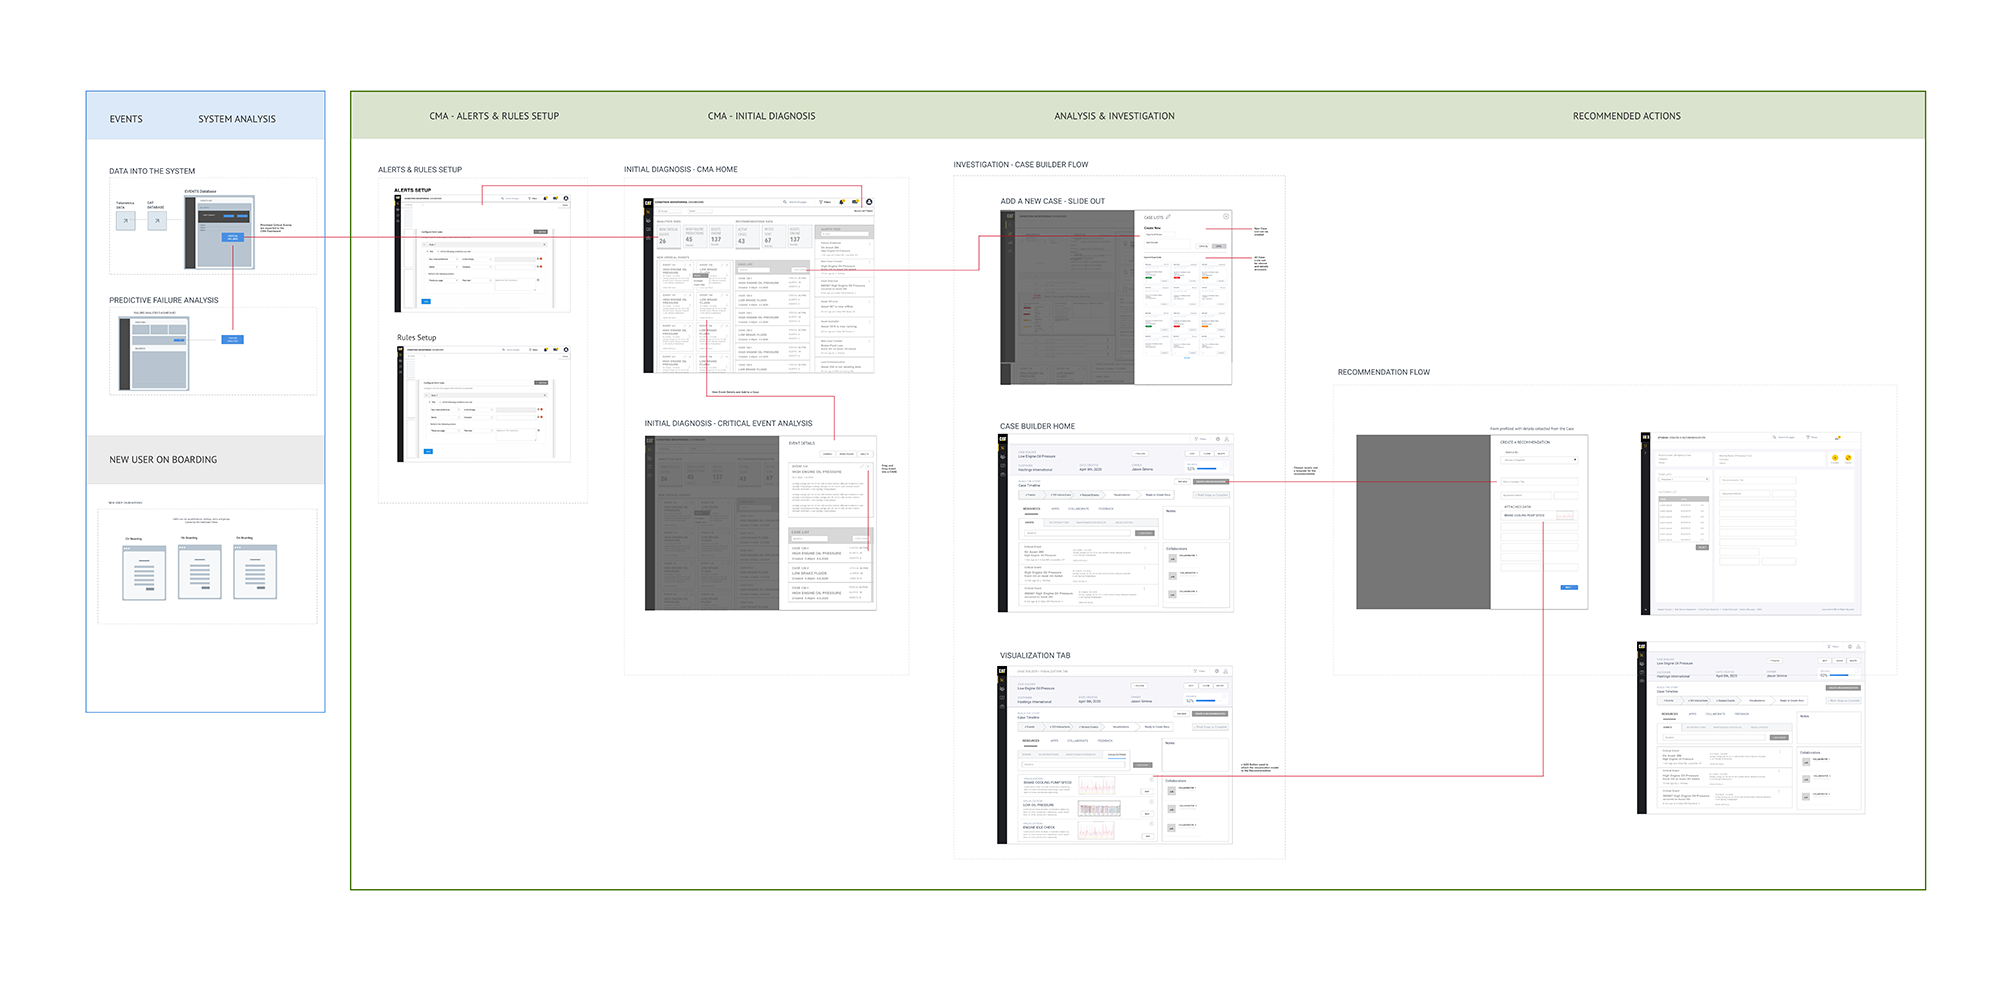
Wire Flow Map
A map of the site flows and external interactions.
User Research Interviews
I conducted 16 user interviews both on-site and on Zoom video calls. Each participant had various client demographics in terms of heavy construction machinery, mining equipment and fossil fuel industry equipment.
Research Questions
We are seeking to learn:
VALUE PROPOSITION: What’s the CMA’s END GOAL?
Why would they pay for this product?
How does the current system help your workflow?
Do the recommendations help you in your business goals?
Does the current problem tool help you attain your business goals?
How does this tool help you attain your business goals?
Methodologies
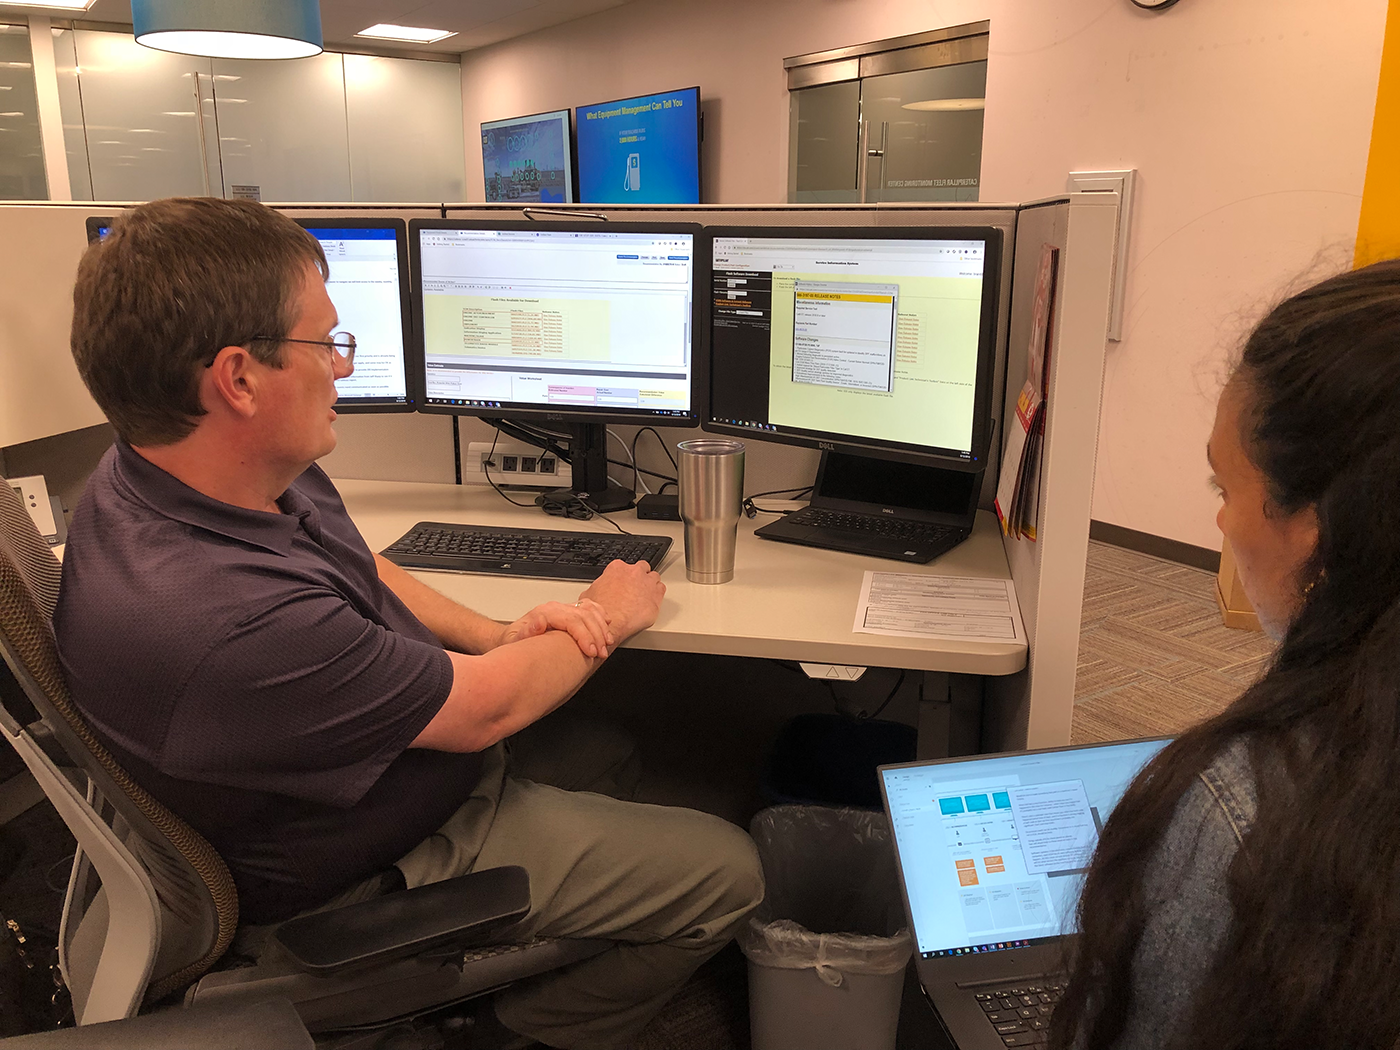
Observe – Contextual Enquiries
Observe – Task Analysis
Contextual Inquiry, also known as ethnographic study, is at its heart a research technique which takes place in the environment where the user is engaged in the problem space.
We observe users performing tasks within the problem space, and probe them about their behaviors, to understand their mindset, problems, and opportunities better.
Engage, Customer interviews are 1:1 interviews conducted with the people that operate within the problem space we wish to explore.

User Flow Analysis
User Flows
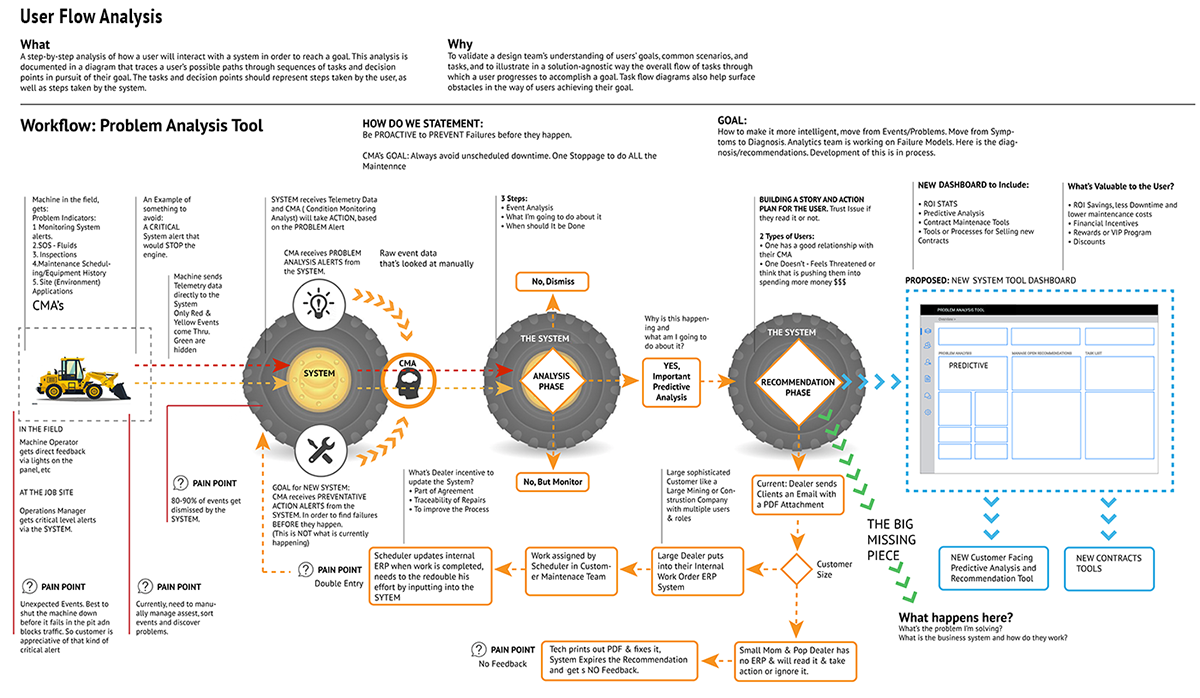
A User Flow is the main path a user follows through an application. They are like mini user journeys. The flow can branch out into many a non-linear paths. By visualizing this path we saw problems, pain points and possible solutions for optimizing the user experience.
The complexity of the Client’s current CM ( Condition Monitoring) product was such that I suggested we create a baseline Task Flow Analysis. The goal was to understand the current situation user’s had to work in and then to optimize users ability to accomplish the main task with the least amount of friction. This helped a great deal in our Design meetings to think through the design before building out the product.
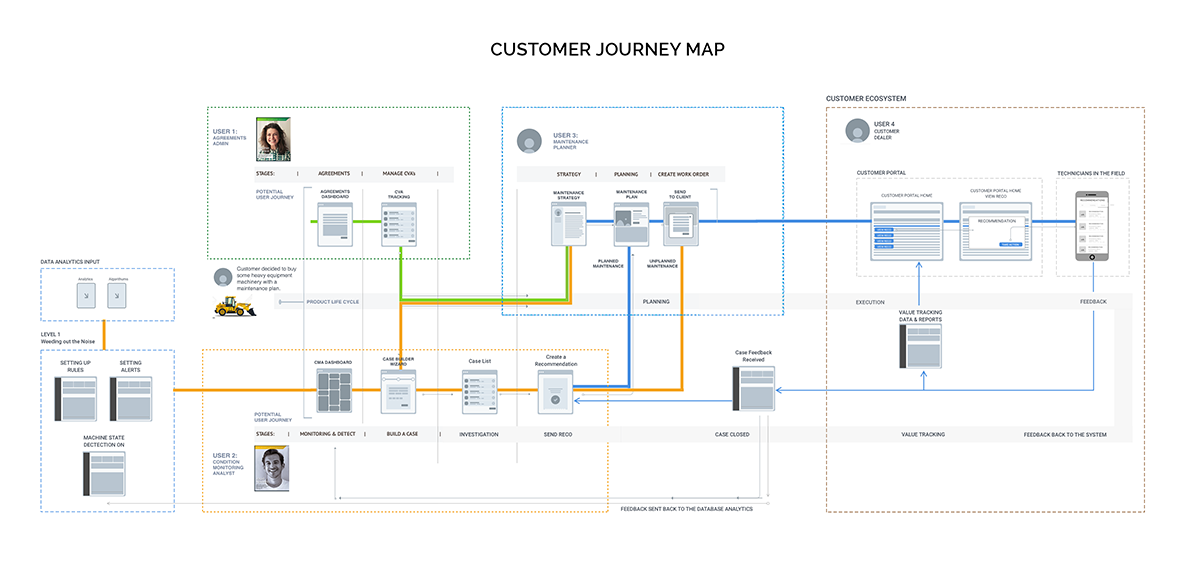
Customer Journey Map
This Journey Map shows both of our Personas going through their task to achieve their optimal goals. It also shows the Product LifeCycle and the final Customer EcoSystem.
03. User Research Analysis
Synthesize our Data
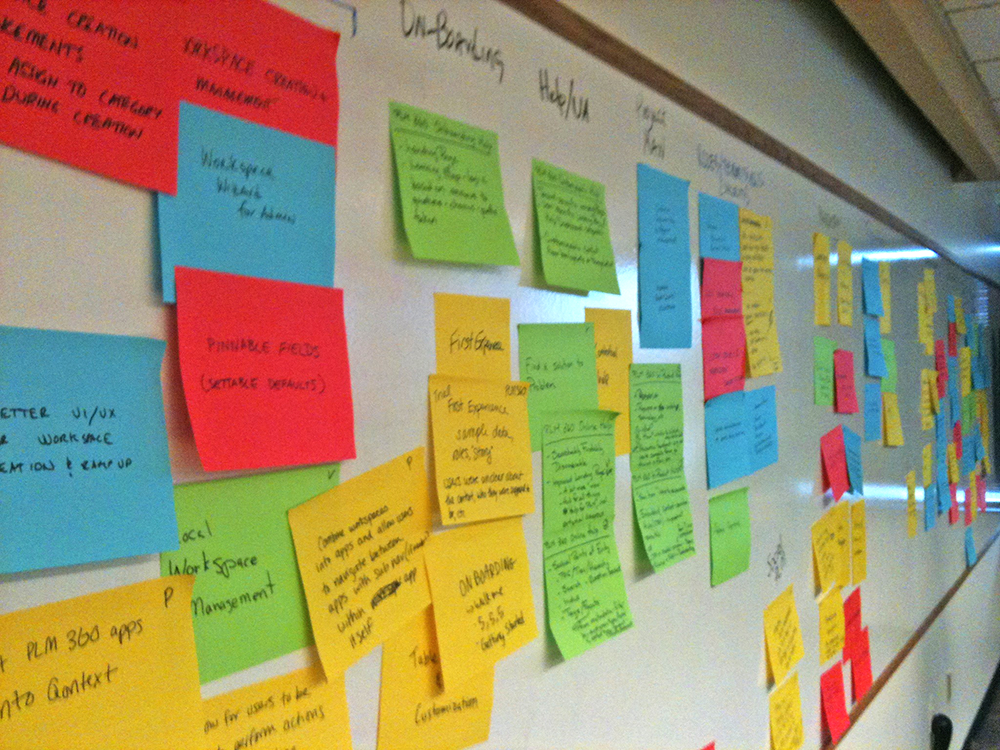
The aim of the Analysis phase is to draw insights from data collected during the Research phase.
Capturing, organizing and making inferences from the “what” can help UX Designers begin to understand the “why”. Communicating the designer’s understanding back to end-users helps to confirm that any assumptions being made are valid.
At this point, we now have identified a clear list of patterns based on our user research. We did this by classifying our user research findings in 3 categories:
• User goals (things they’d like to obtain)
• User pains (things they have trouble with)
• User tasks (things they have to do)
Then we defined and clarified actionable point of view (POV) or problem statements.
A POV statement can be defined as [User/Persona] + [Need] + [Insight]
Mapping the Technical Details
SYSTEM IMPLEMENTATION & TECHNICAL DETAILS
The technical implementation required careful consideration of data architecture and processing capabilities. I designed a modular dashboard system that could handle real-time sensor data streaming, normalize inputs from various equipment types, and provide meaningful analytics. The system included customizable widgets, role-based views, and comprehensive audit trail tracking, all while maintaining sub-second response times for critical operations.
The interface architecture was structured in layers, allowing for progressive disclosure of information based on user roles and needs. This included a high-level dashboard for quick status checks, detailed analysis views for in-depth investigation, and administrative controls for system configuration. Each layer was designed to handle increasing levels of complexity while maintaining usability.
INTELLIGENT ALERT HANDLING SYSTEM
One of our key achievements was the development of an intelligent alert handling system. This system automatically filtered and prioritized incoming alerts, distributed workload based on expertise and availability, and tracked response metrics. The decision support system incorporated a recommendation engine that learned from historical cases, matched similar incidents, and provided suggested actions based on past successes.
The workflow design significantly reduced alert response time by incorporating smart filtering, automated prioritization, and quick action capabilities. Context retention features meant that users could quickly resume work on complex cases without losing their place in the investigation process.
USER EXPERIENCE OPTIMIZATION
To optimize the user experience, we focused heavily on reducing cognitive load through careful information hierarchy and visual prioritization. The interface used progressive disclosure techniques and smart defaults to present information in digestible chunks. Performance optimization included implementing lazy loading, data caching, and background processing to maintain responsiveness under heavy loads.
The result was a significant reduction in alert response time and significantly improved user satisfaction scores. The system successfully balanced complex technical requirements with intuitive user interaction, creating an engaging experience that drove high adoption rates among CMAs globally.
Personas
Value Complexity Matrix
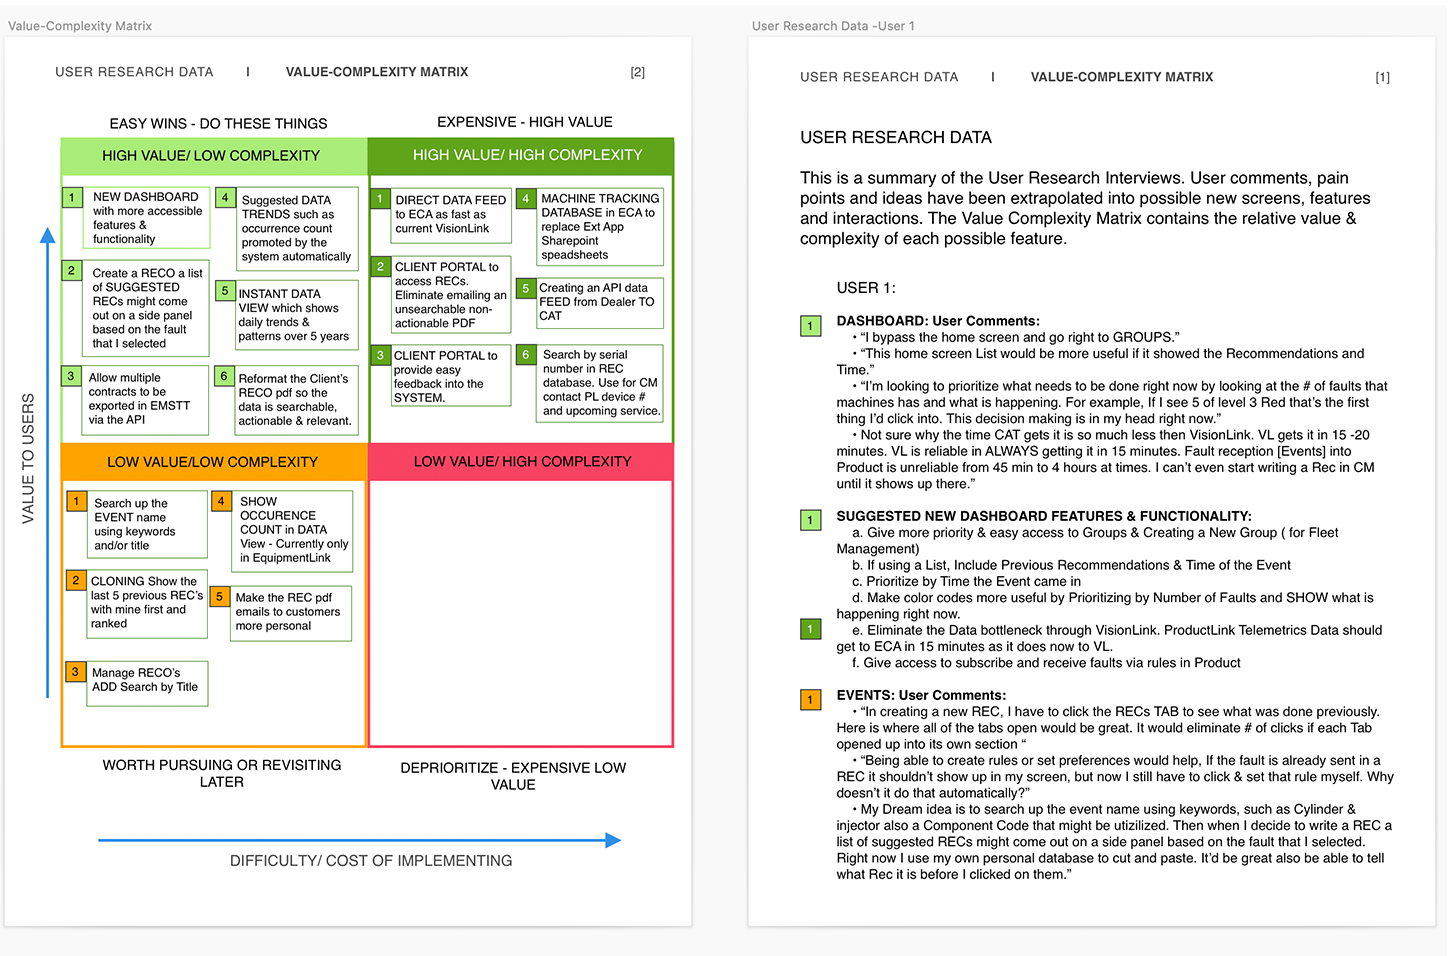
As its name implies, value–complexity matrices plot the potential value of a product feature alongside the complexity of implementing such features. The business value of a project can be categorized as either high or low, whereas the implementation complexity of a project can be represented as low or high.
Wire Flow Map
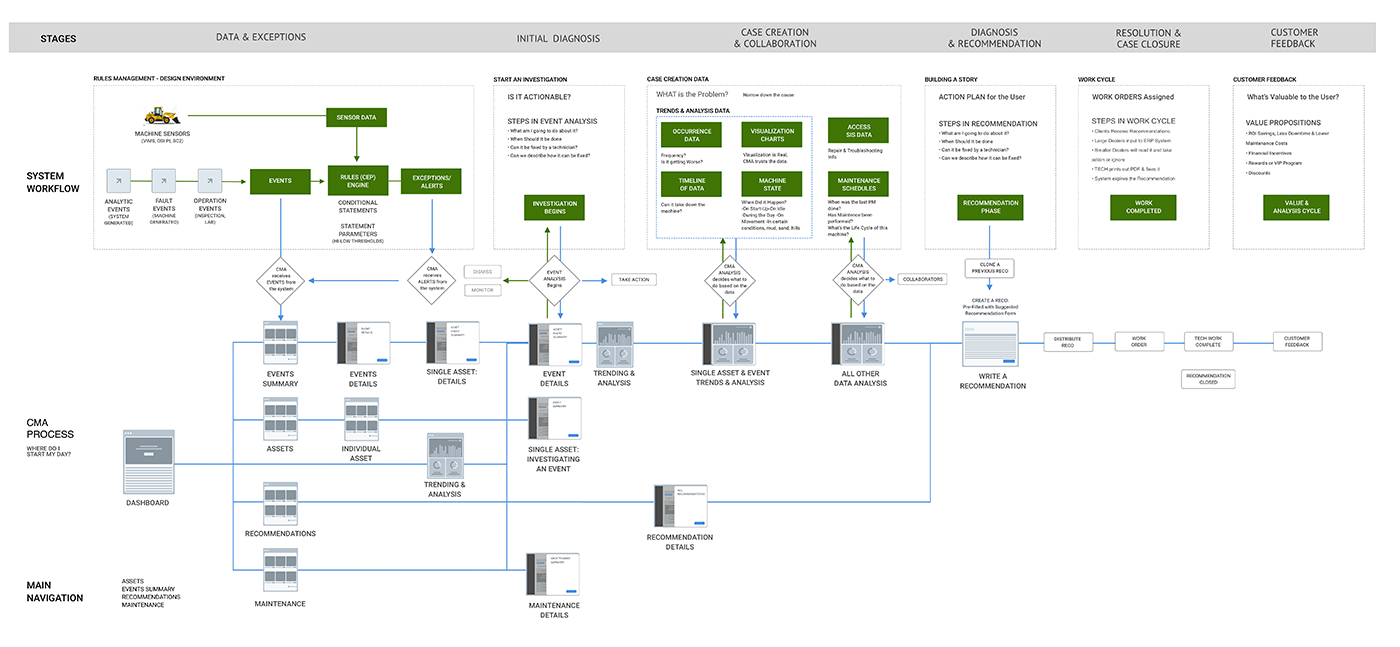
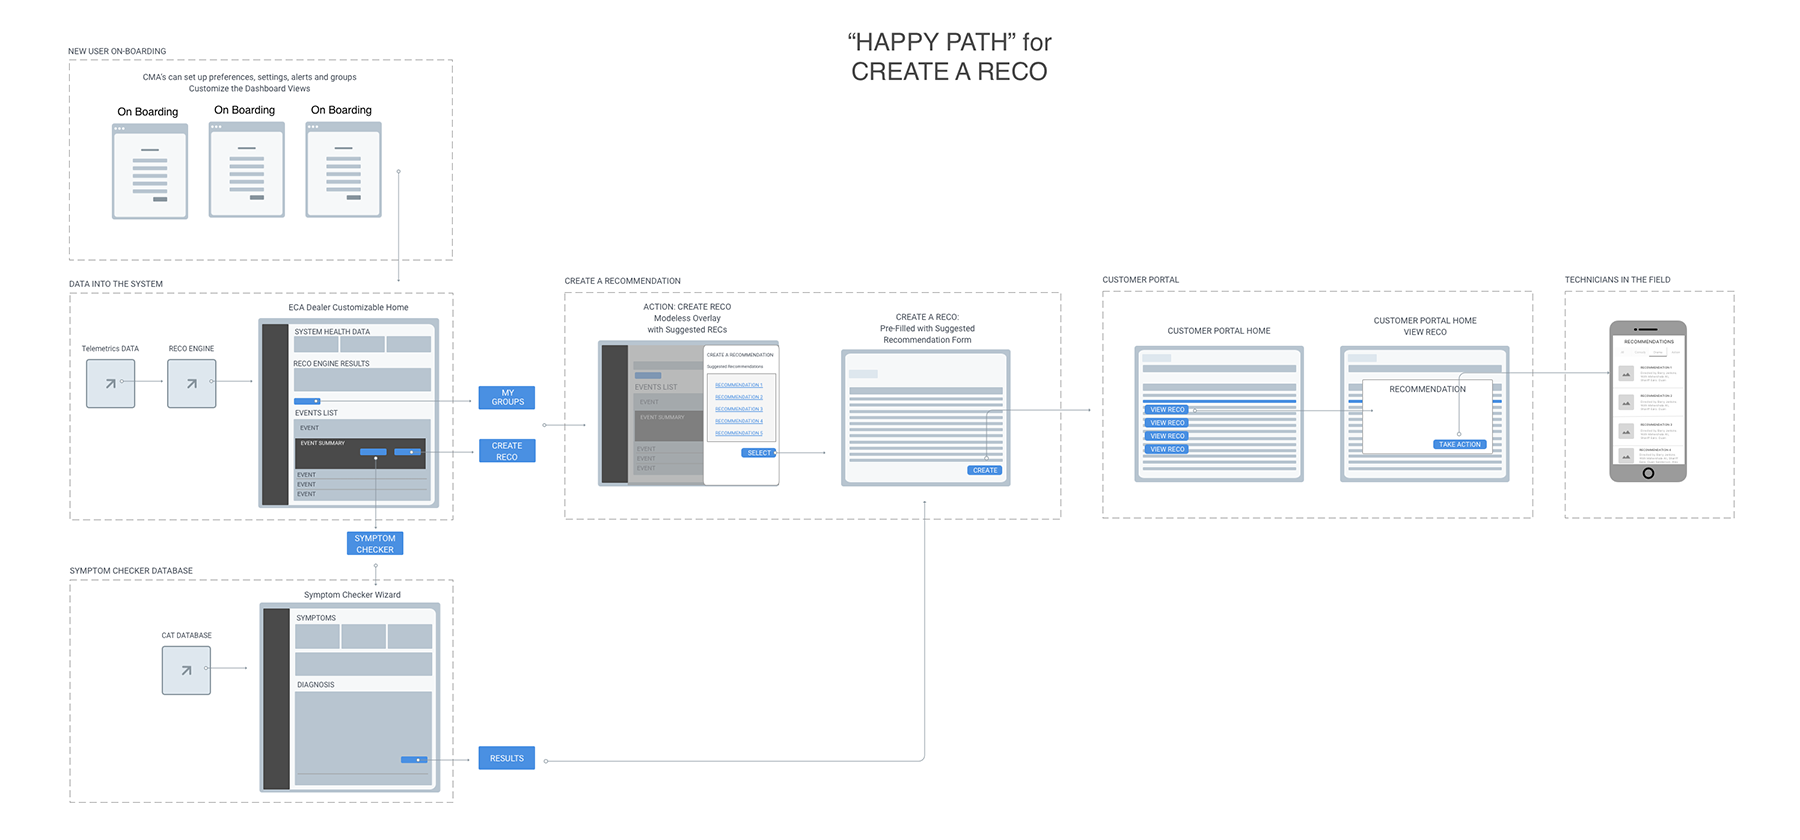
Again because of the complexity of the systems we were trying to link together, I created a Wire Flow Map. This particular one combines a wireframe-style of page layout designs with a simplified flowchart way of representing phases of the product journey and the interactions at each of those areas.
04. Design
The DESIGN PHASE
The Design phase of a UX project is collaborative (involving input and ideas from different people) and iterative (meaning that it cycles back upon itself to validate ideas and assumptions).
Building on the user feedback loop established in previous phases, the premise of the Design phase is to put ideas in front of users, get their feedback, refine them, and repeat. These ideas may be represented by paper prototypes, interactive wireframes, or semi-functioning prototypes, all deliberately created in low-fidelity to delay any conversation relating to graphic identity, branding or visual details.
A Wire Flow “Happy Path”
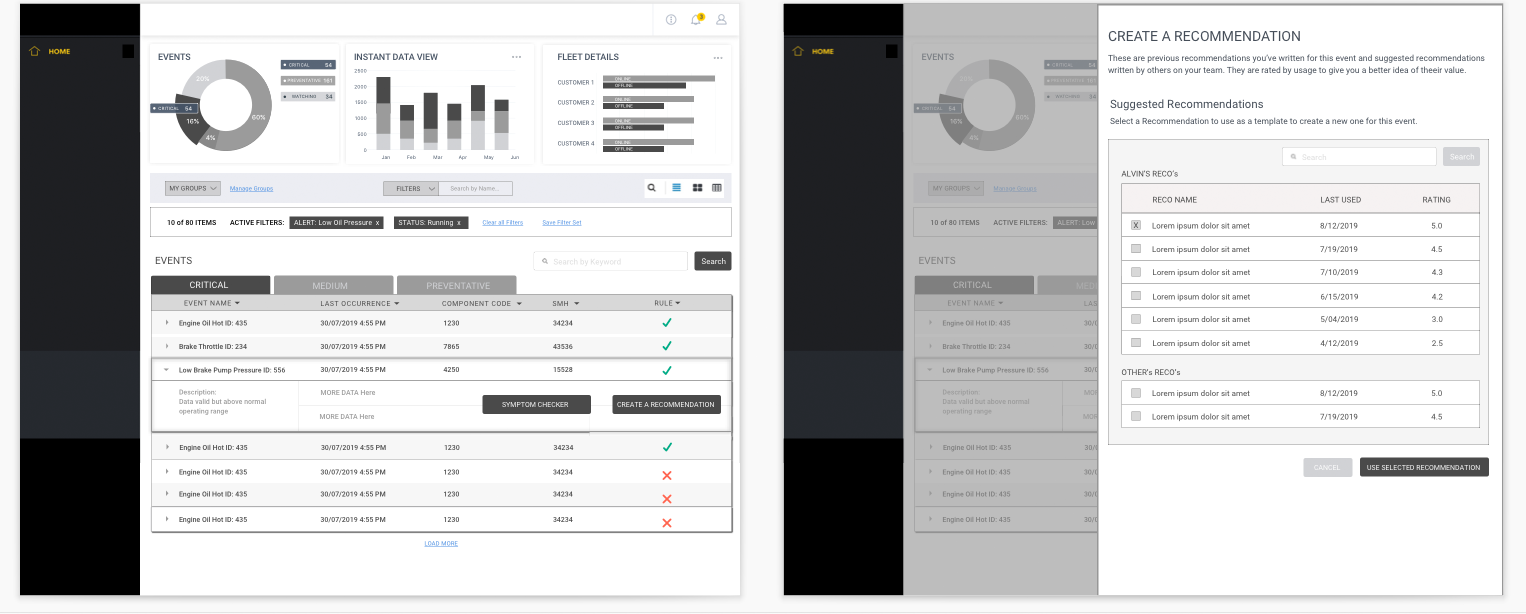
A Create a Recommendation Flow
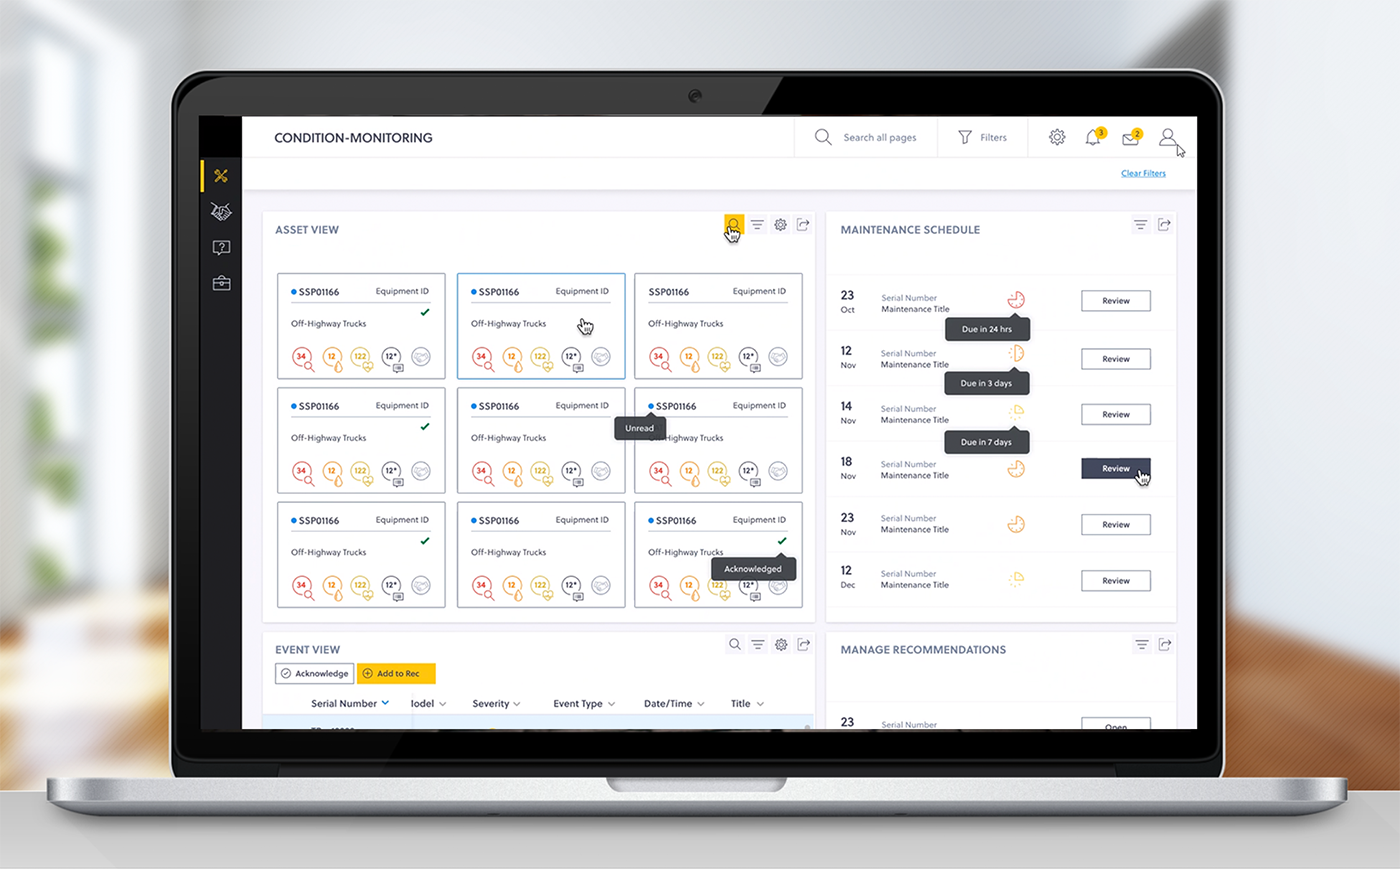
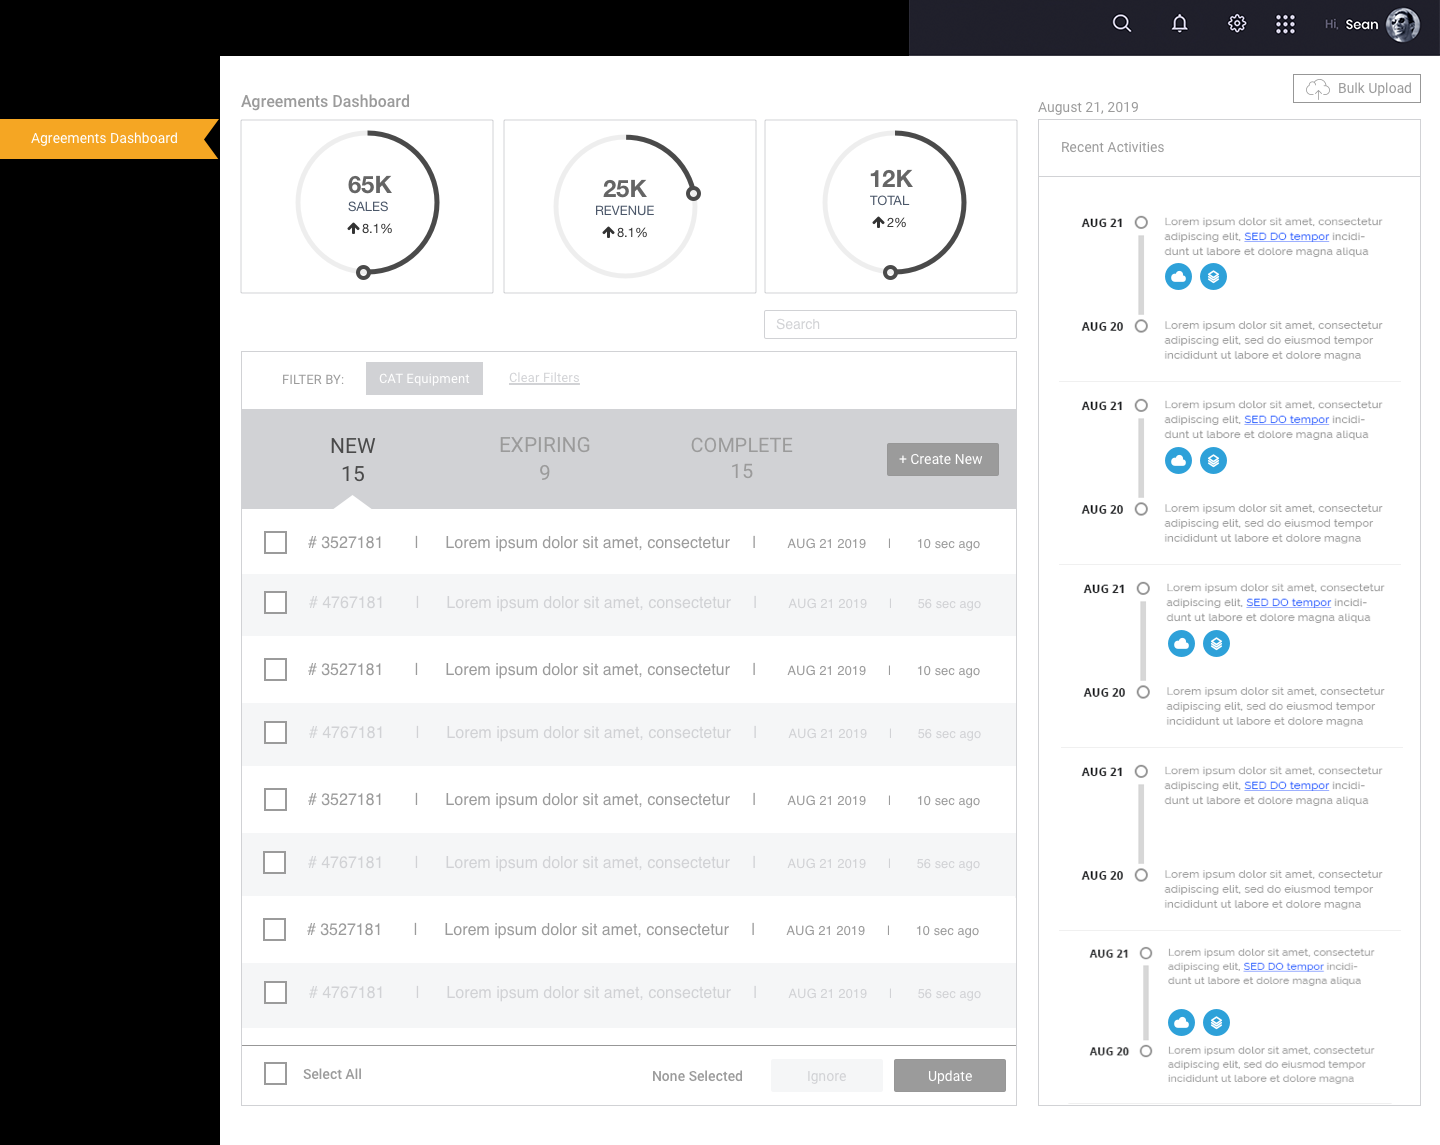
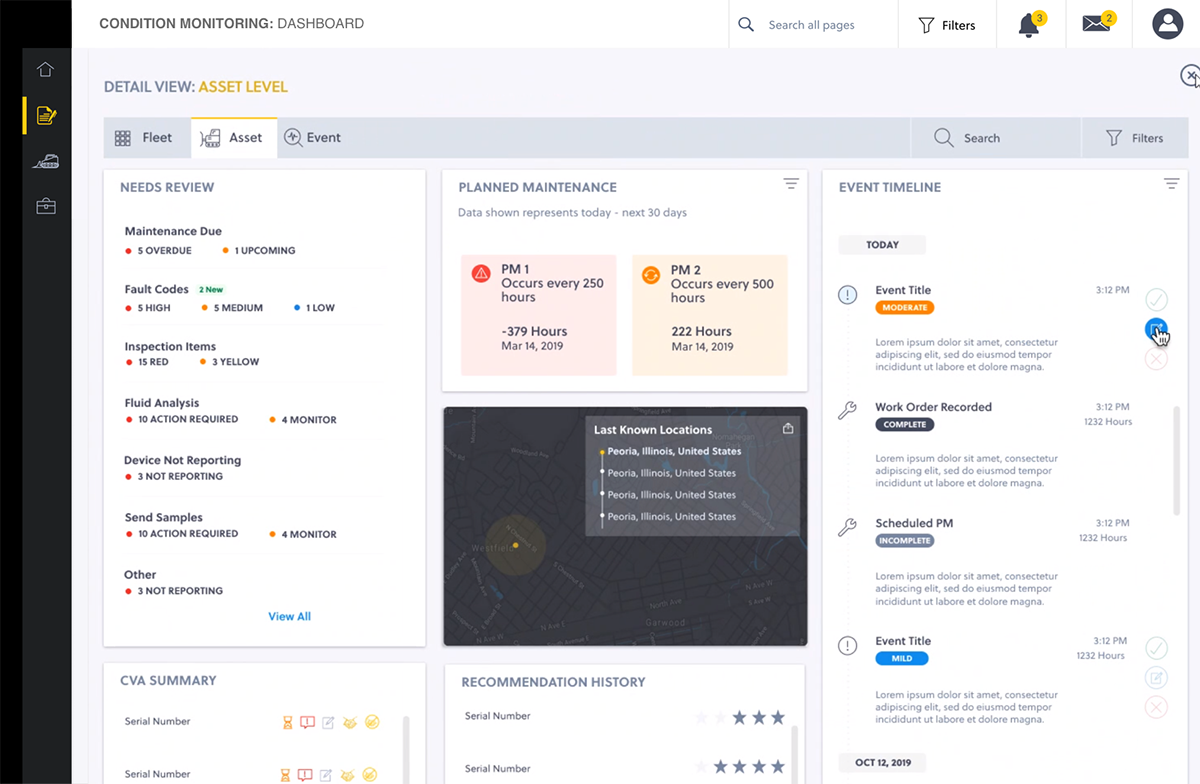
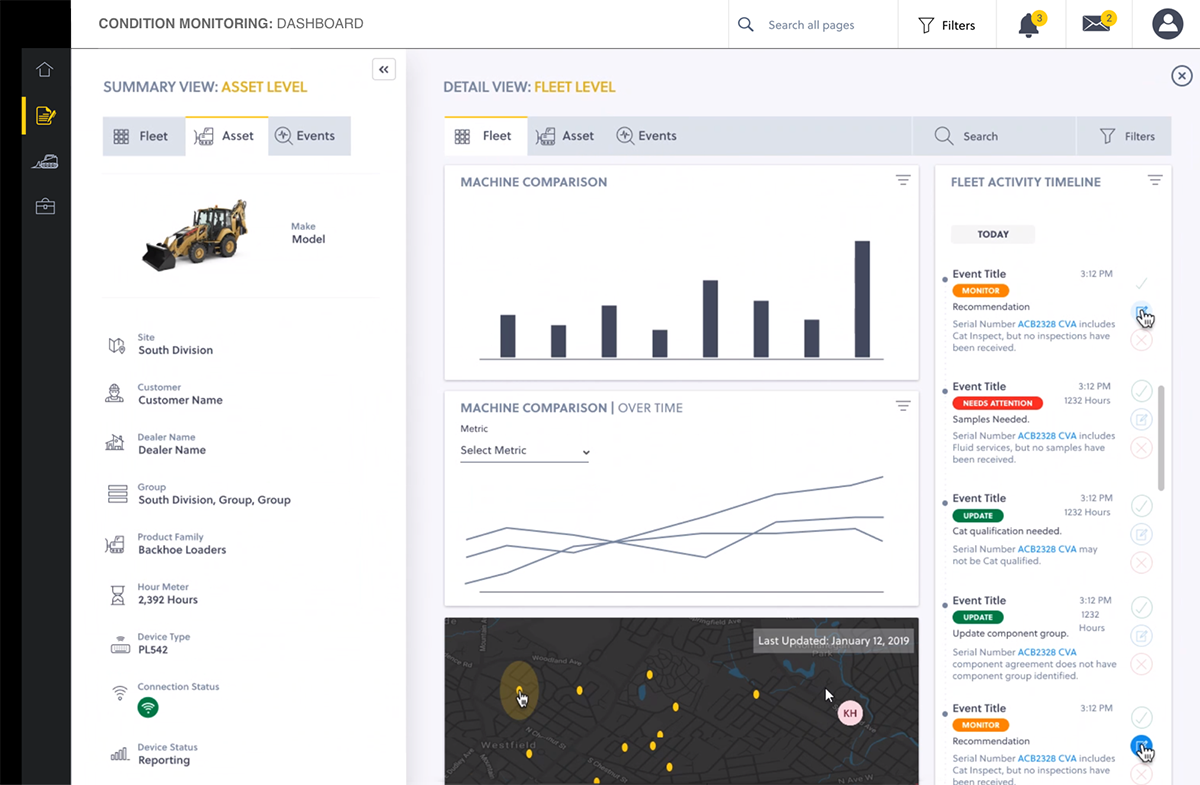
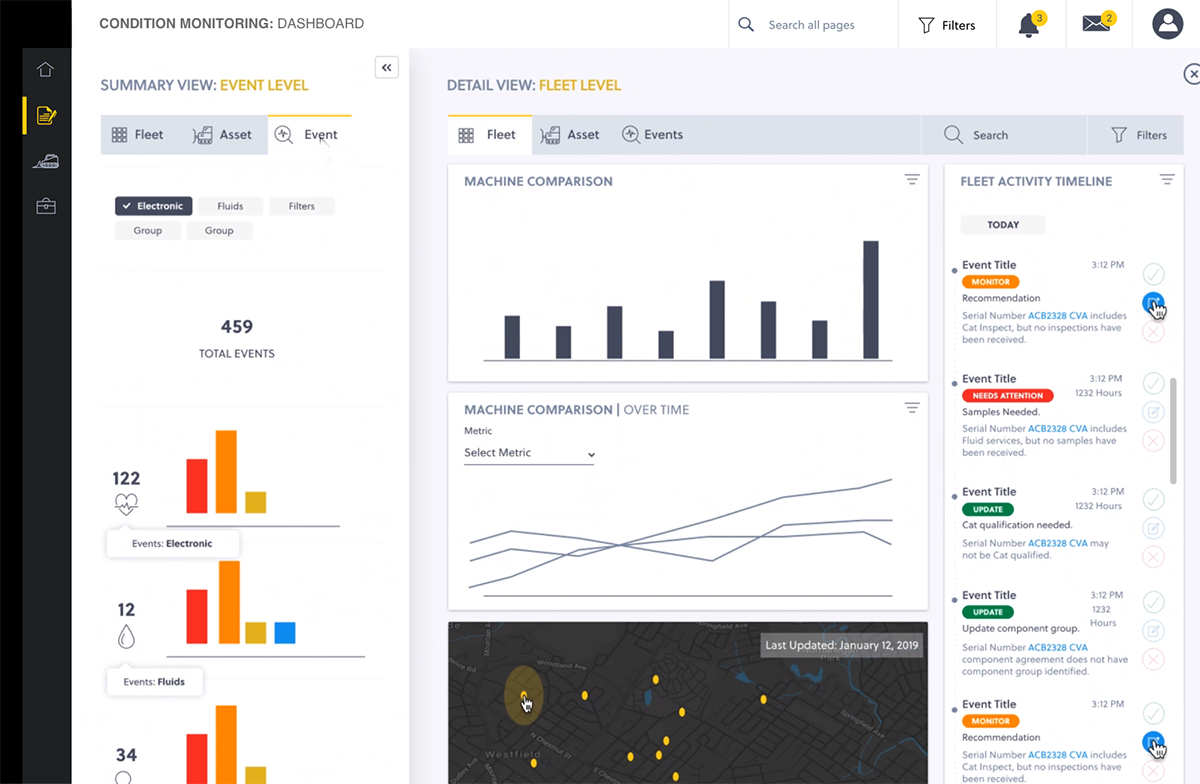
Dashboard Wire Frames
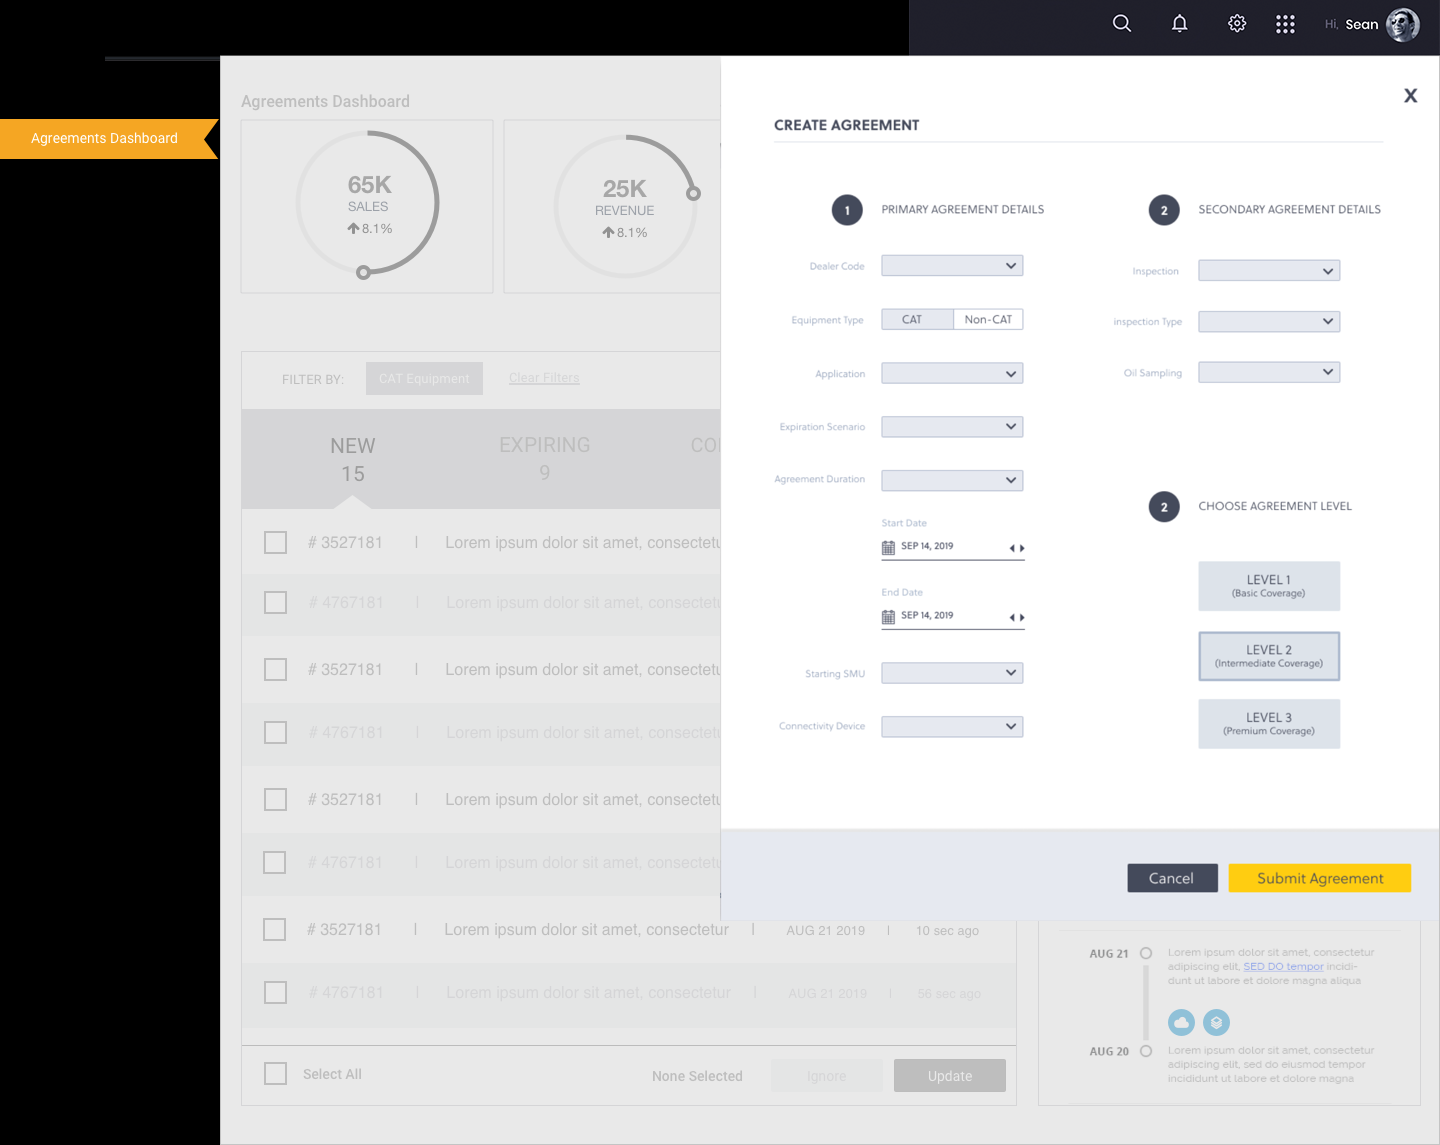
Agreements Panel Wire Frames
High Fidelity
Dashboard Design
